Novo UBI Insurance
AI Insights
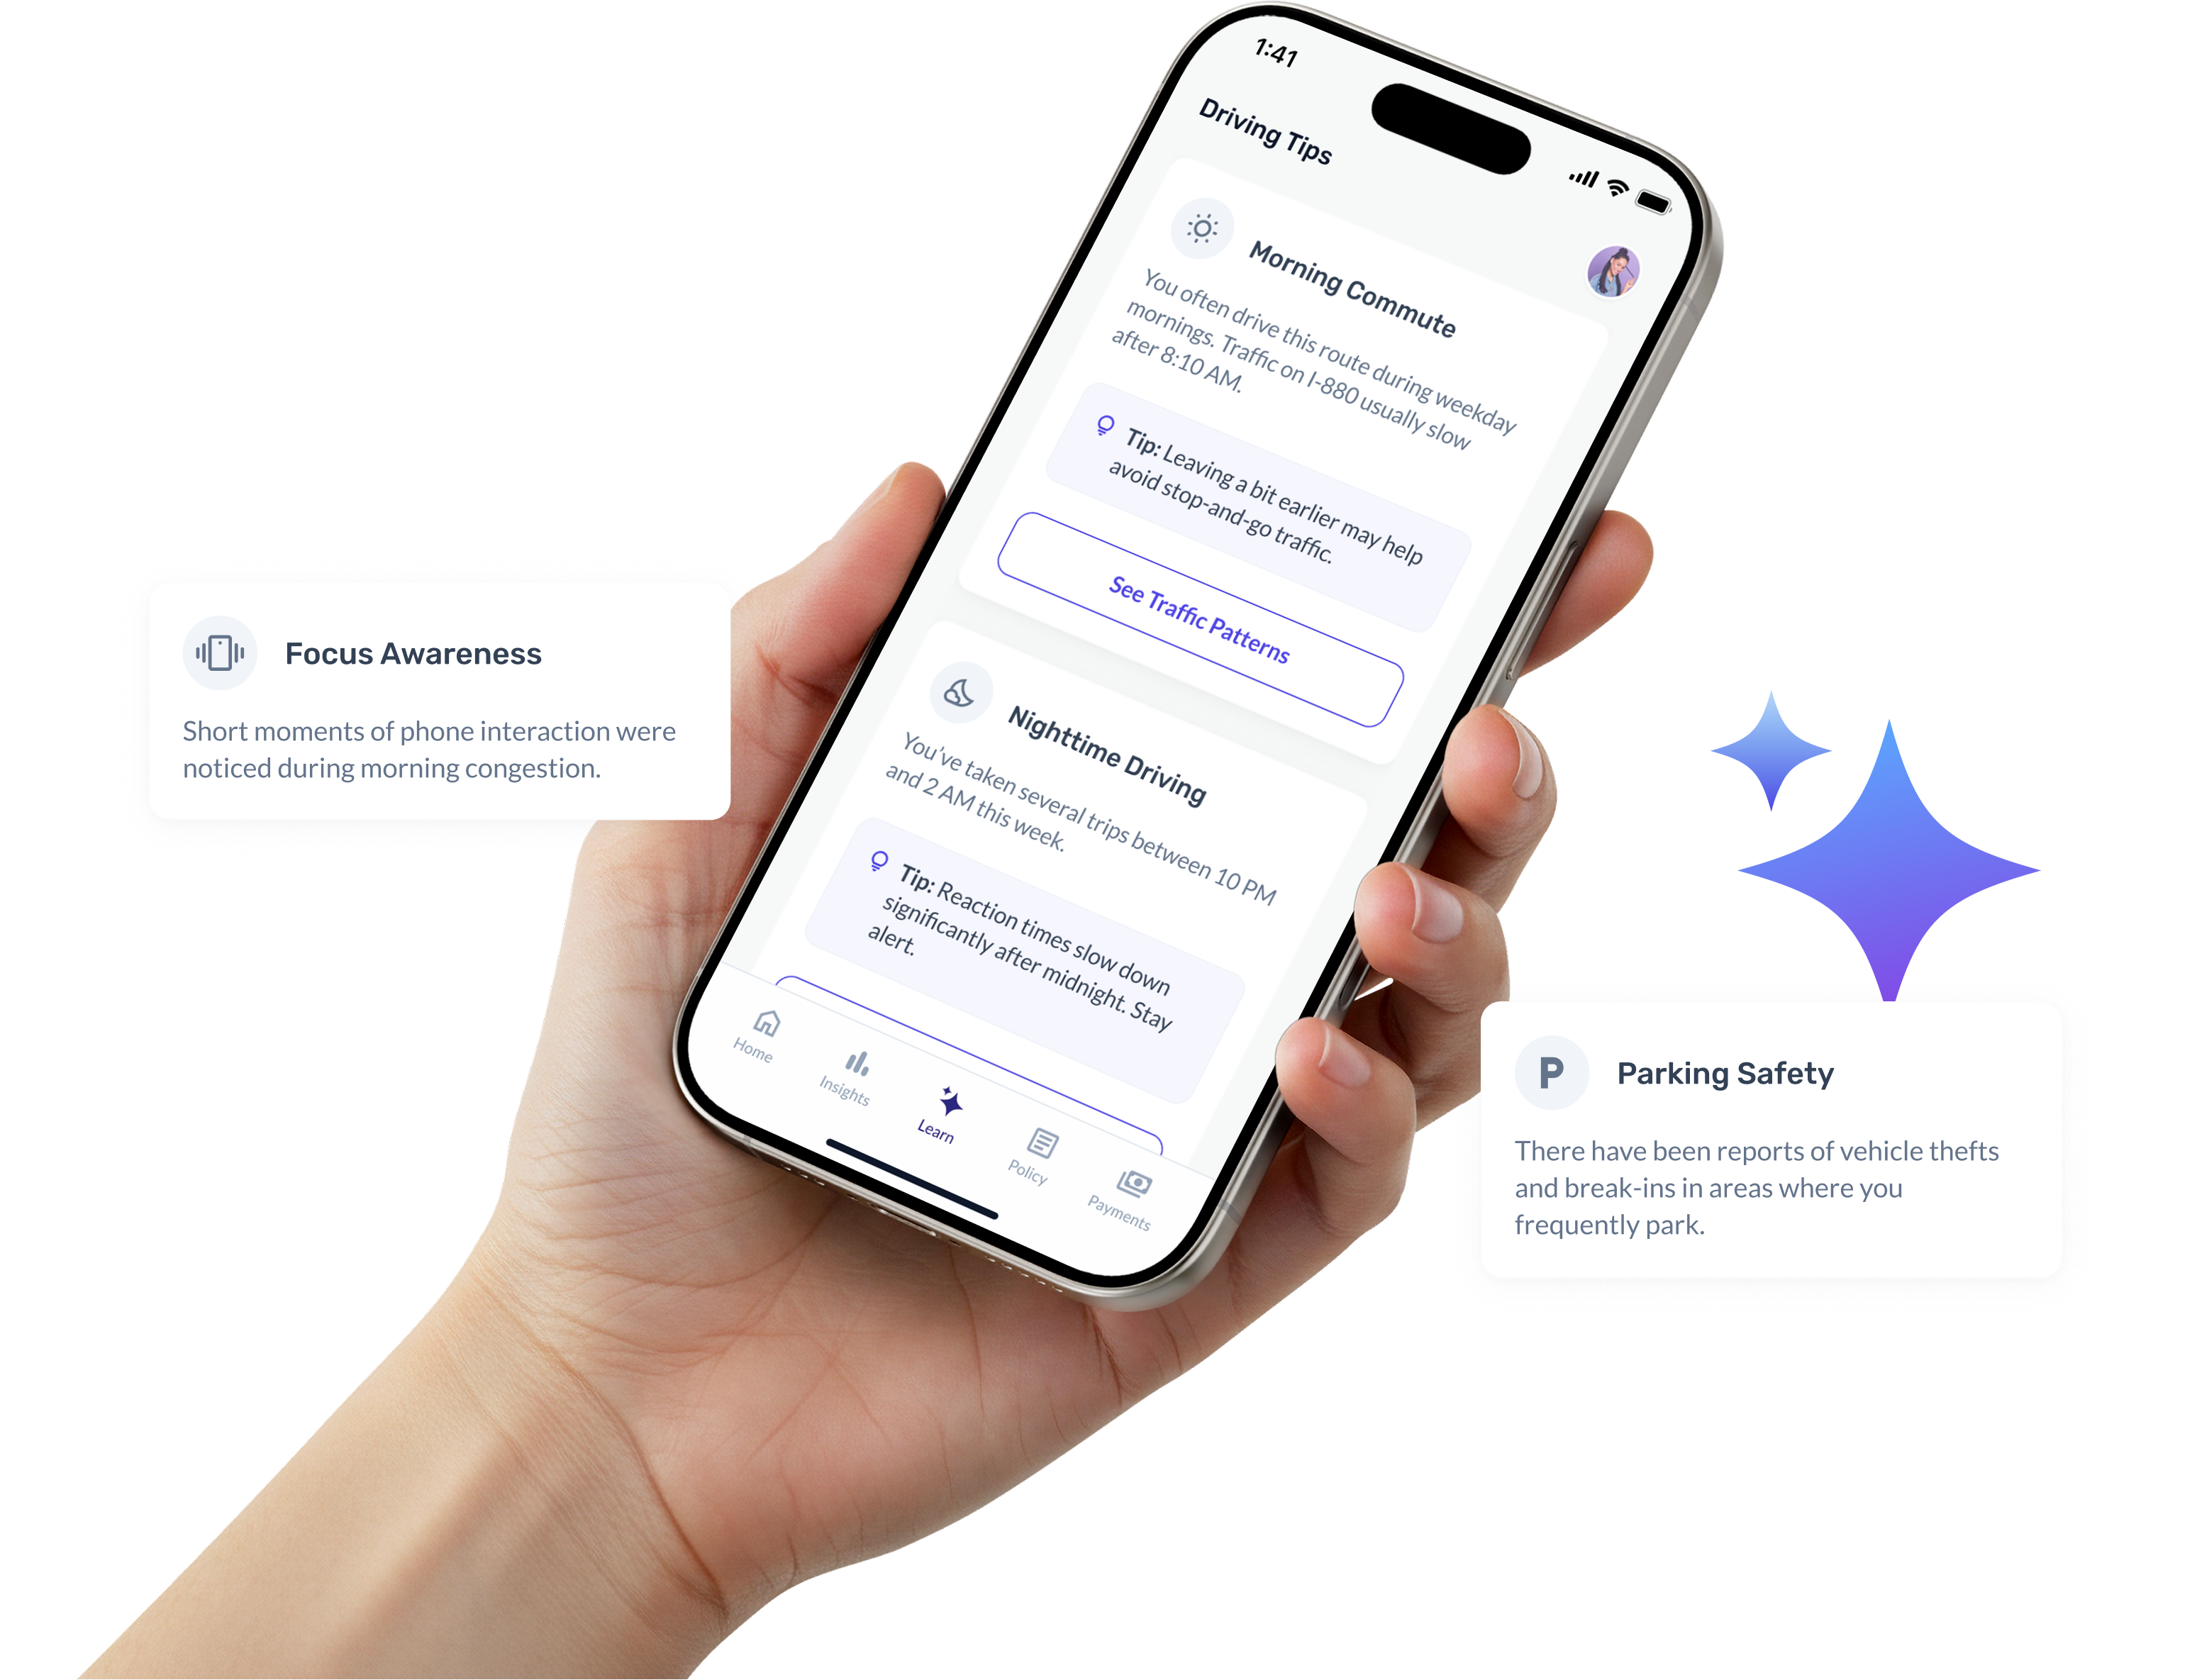
AI-powered insights that help drivers understand their habits and how they affect safety and insurance cost.
Project Overview
This project explores how a UBI app can move beyond dashboards to help drivers understand how everyday driving impacts insurance costs.
By embedding AI into the core experience, the app translates vehicle telemetry, route and traffic context, weather and road conditions, and parking safety data into clear, personalized insights that explain what happened, when it happened, and what users can do next.
Current Problems
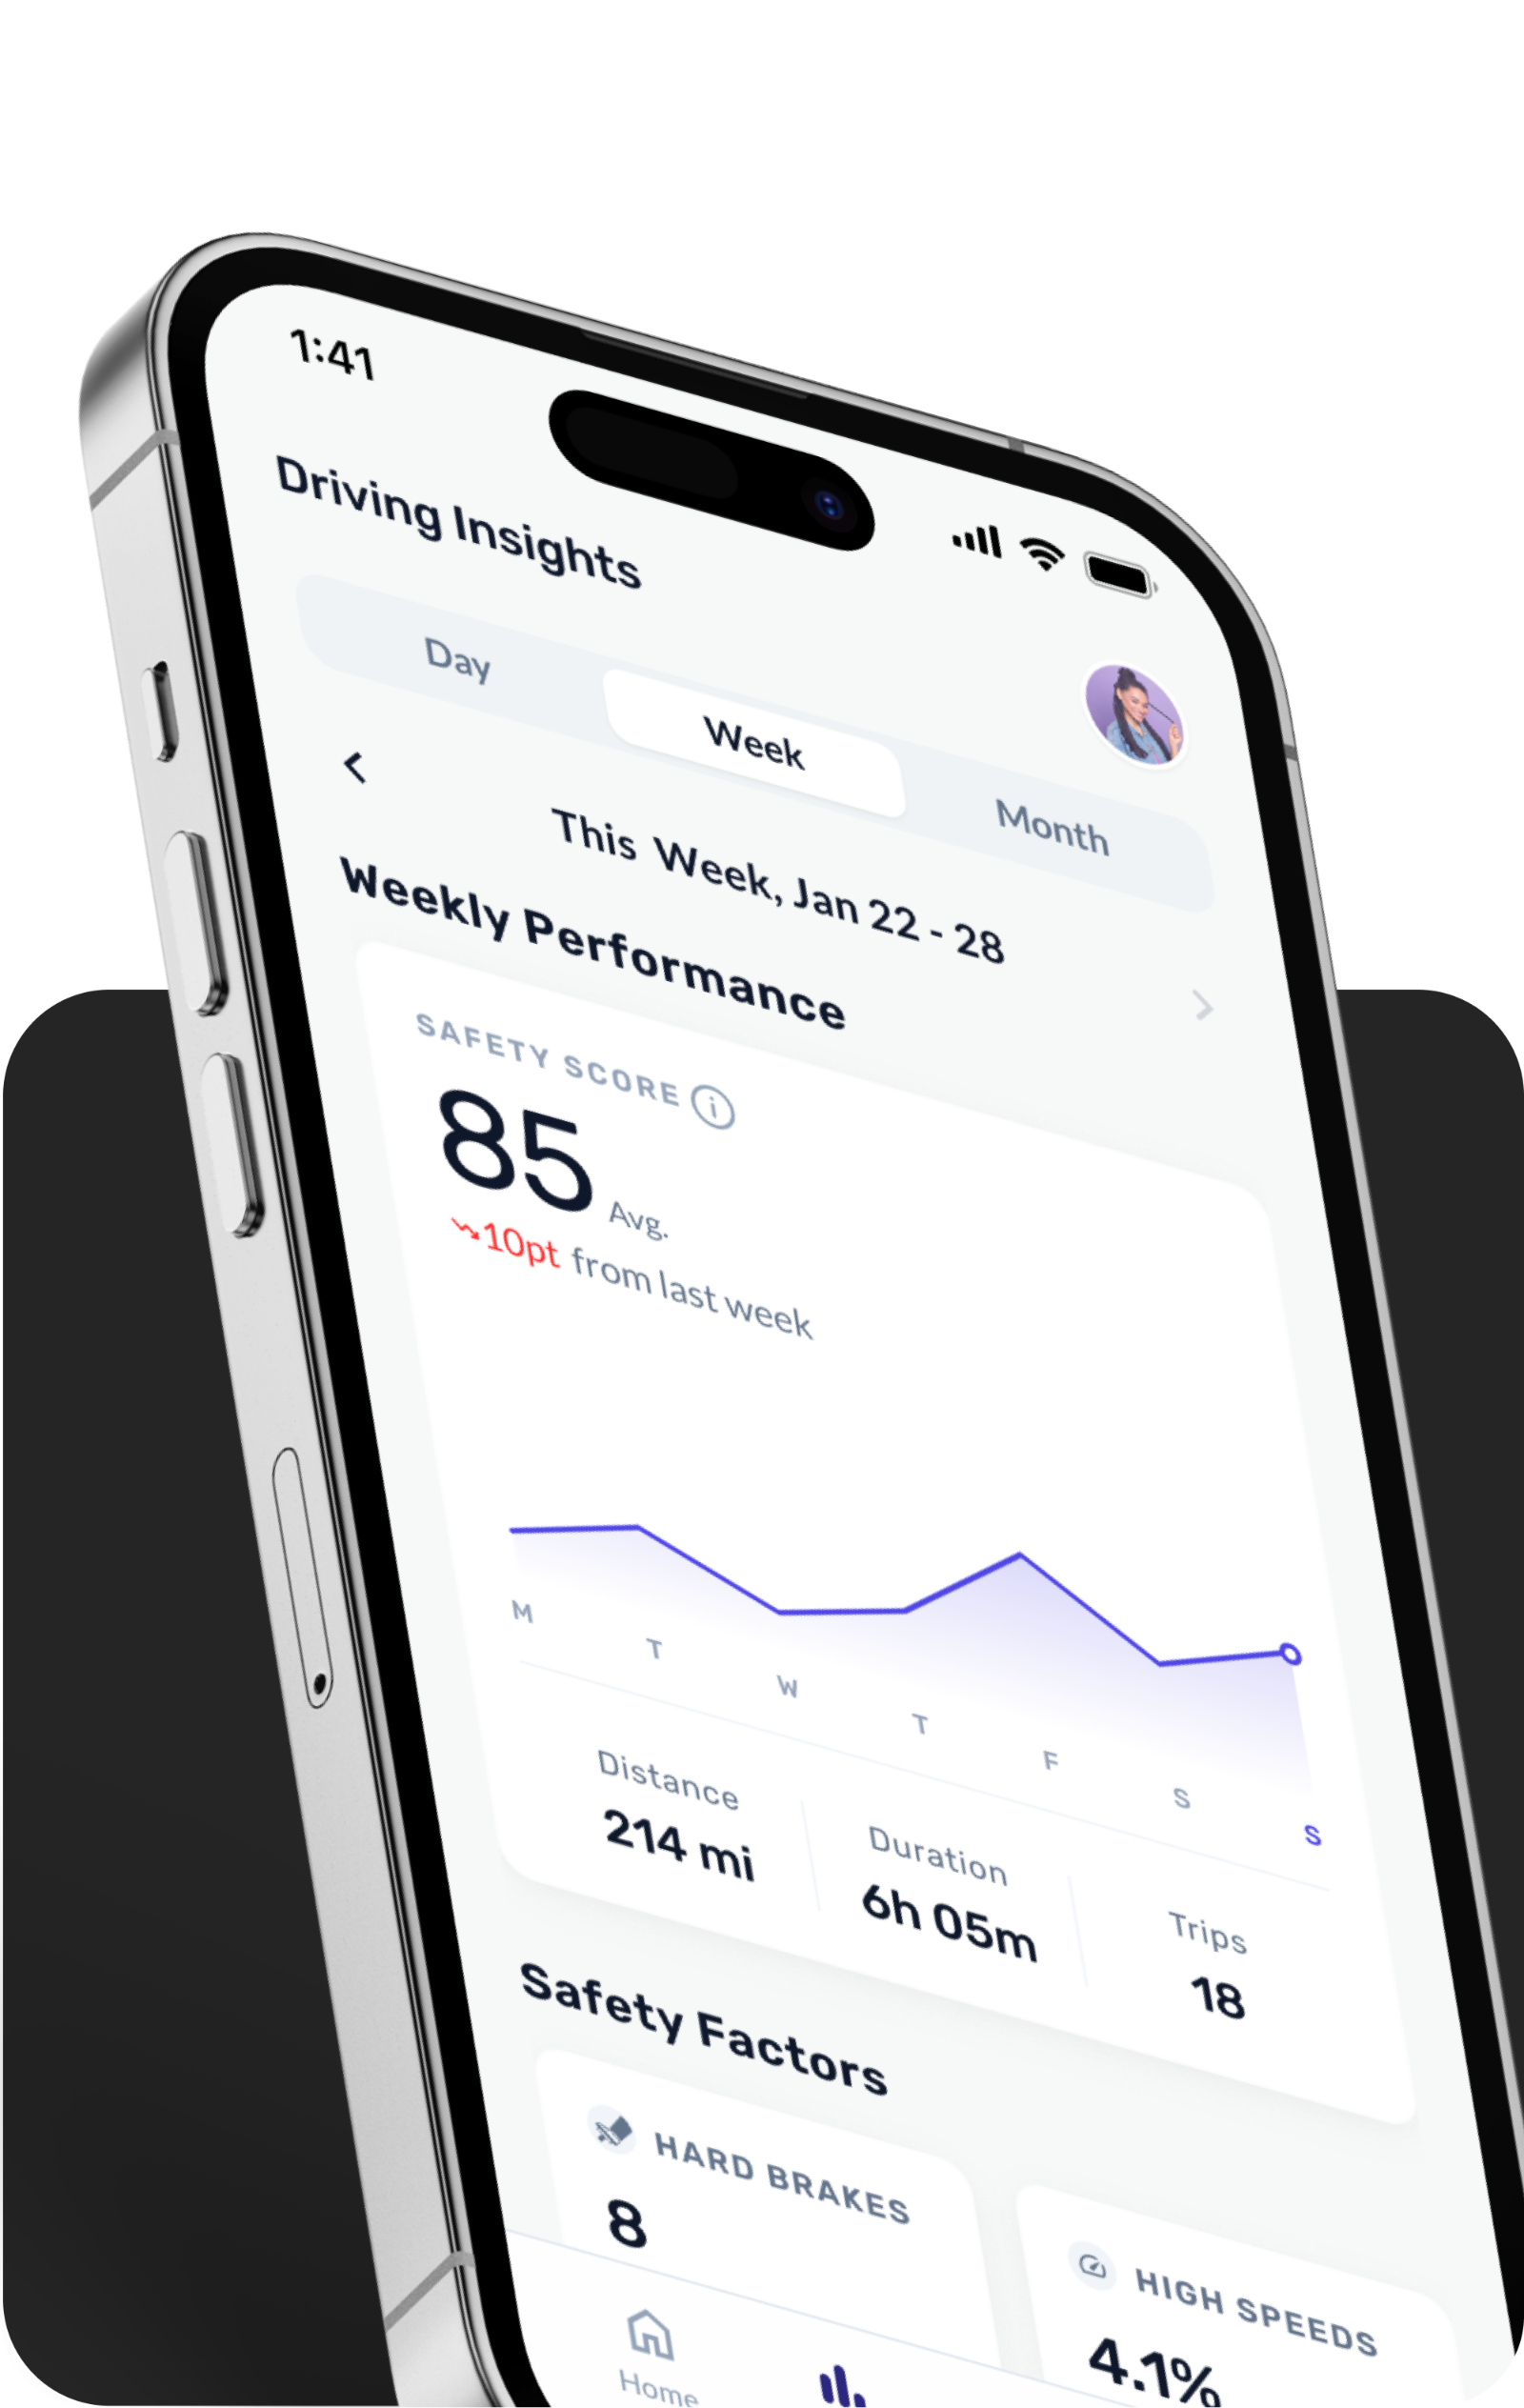
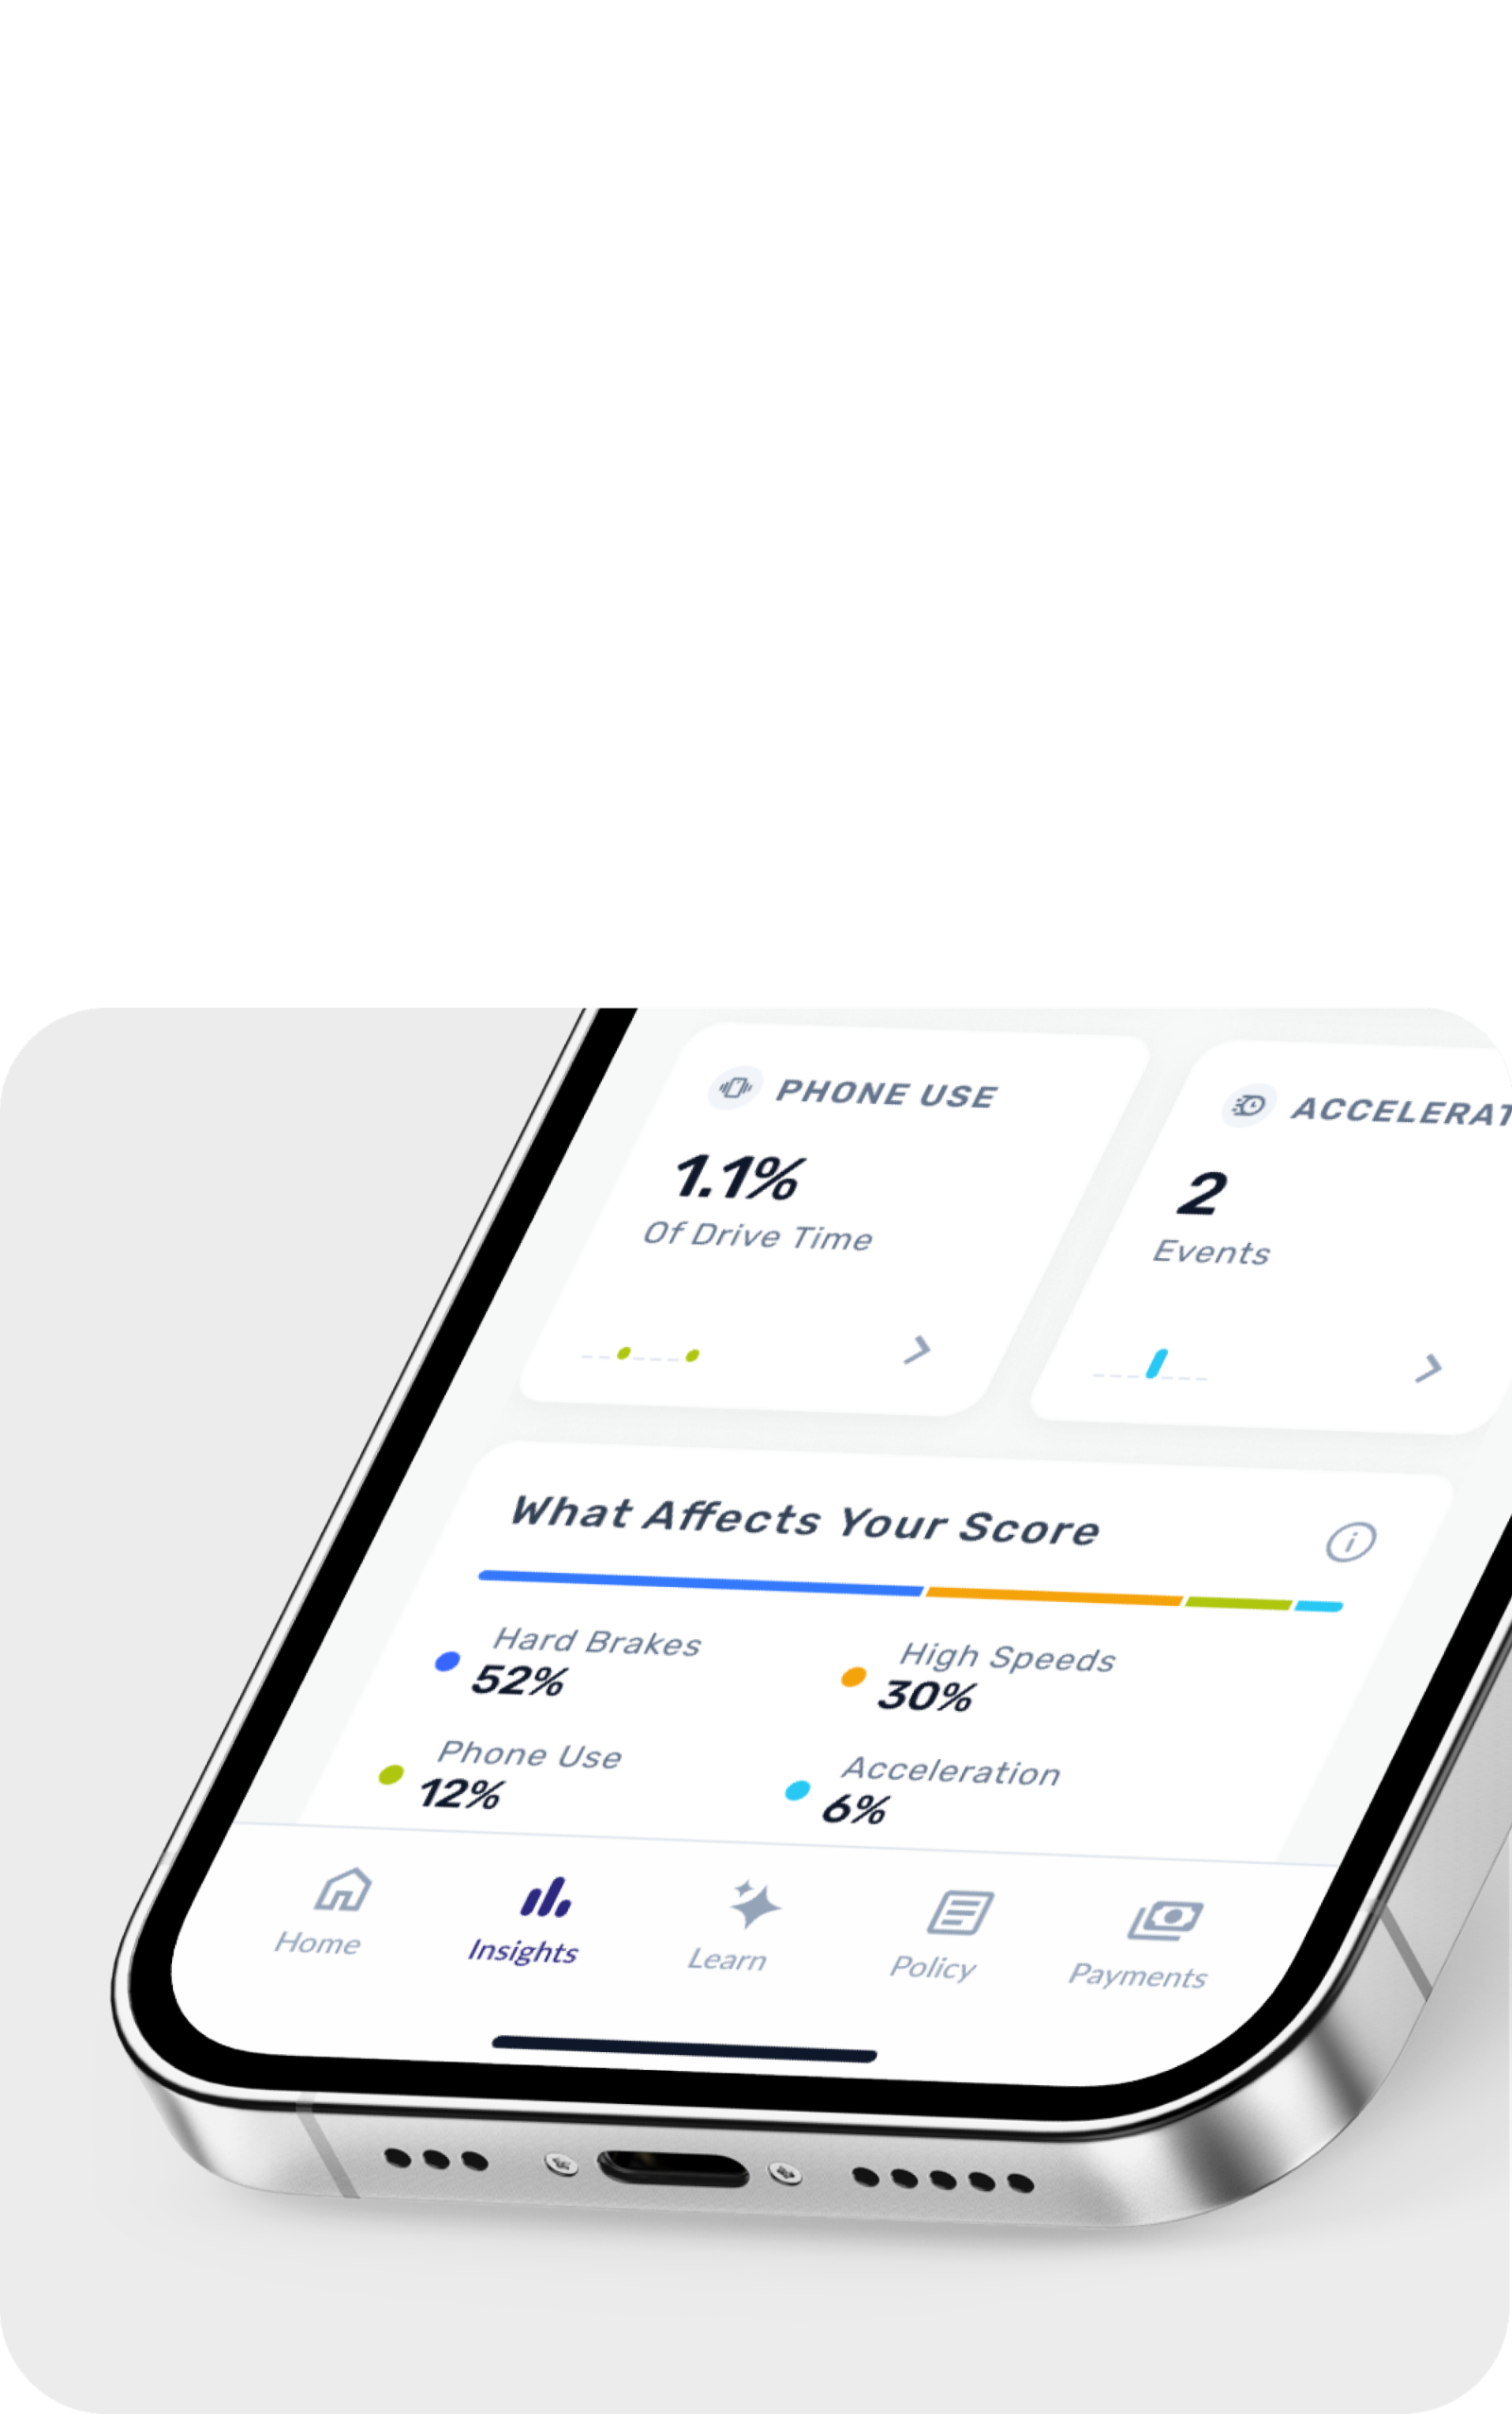
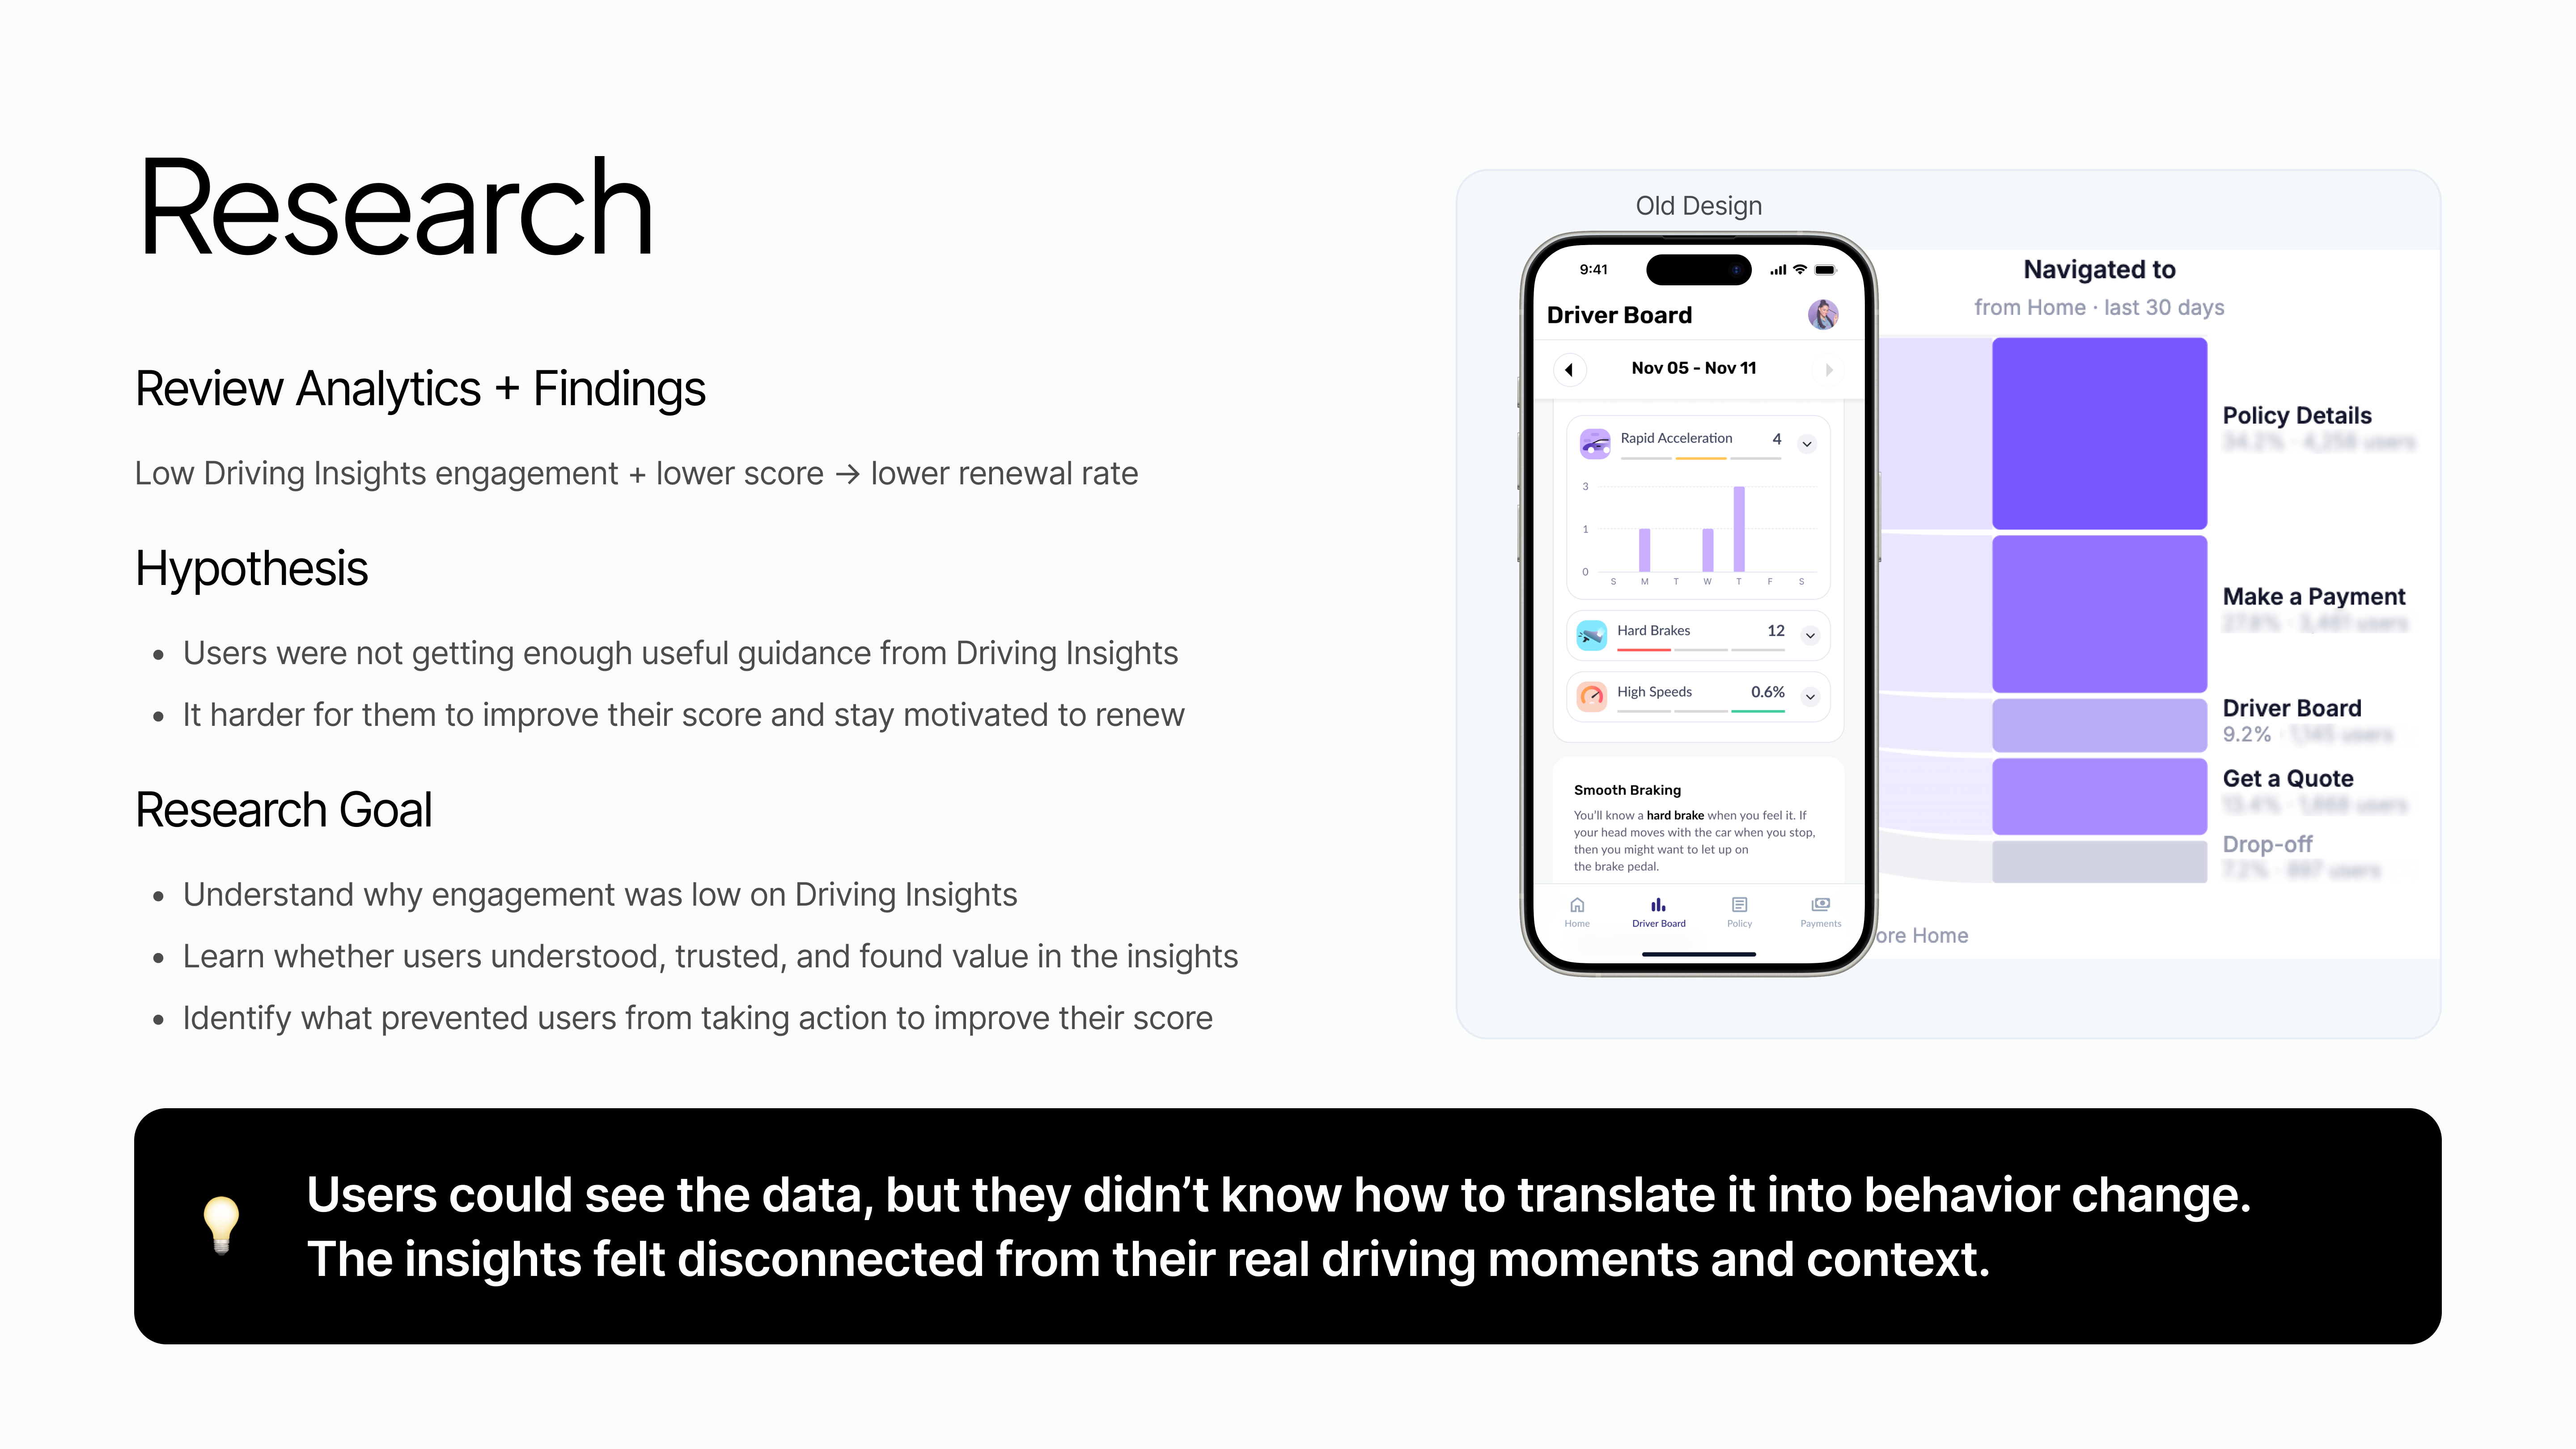
Users could see scores and charts, but not what truly impacted their insurance or how to improve. Dashboards showed raw data, while generic tips failed to connect insights to real driving moments.
Design Challenge
How might we use AI to turn complex driving data into clear, personalized feedback drivers can trust and act on?
Turn real driving data into meaningful insight
Understand how your unique driving patterns affect your insurance with AI-powered tips tailored to your daily routes, habits, and conditions.
Personalized Insights
Understand how your driving affects insurance, with AI tips tailored to your routes and habits.
Clear Cause and Effect
See what happened on each trip, when it happened, and why it matters.
Actionable Guidance
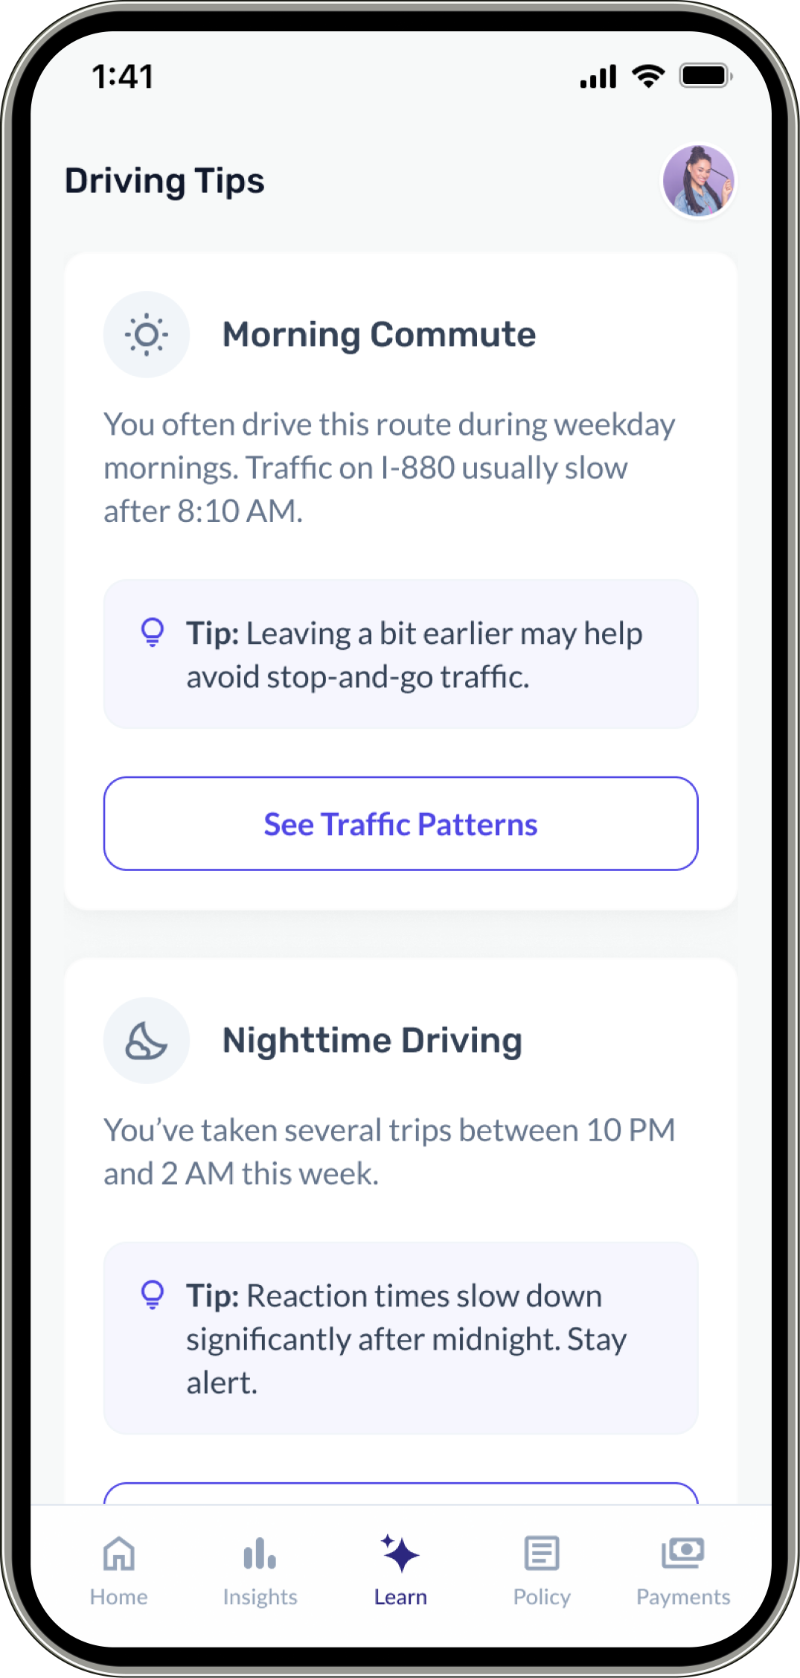
Get practical next steps based on real driving moments, from commute timing to safer parking.
Built for Trust
Clear data sources, explainable insights, and full user control keep feedback supportive and transparent.
From Insight to Alignment
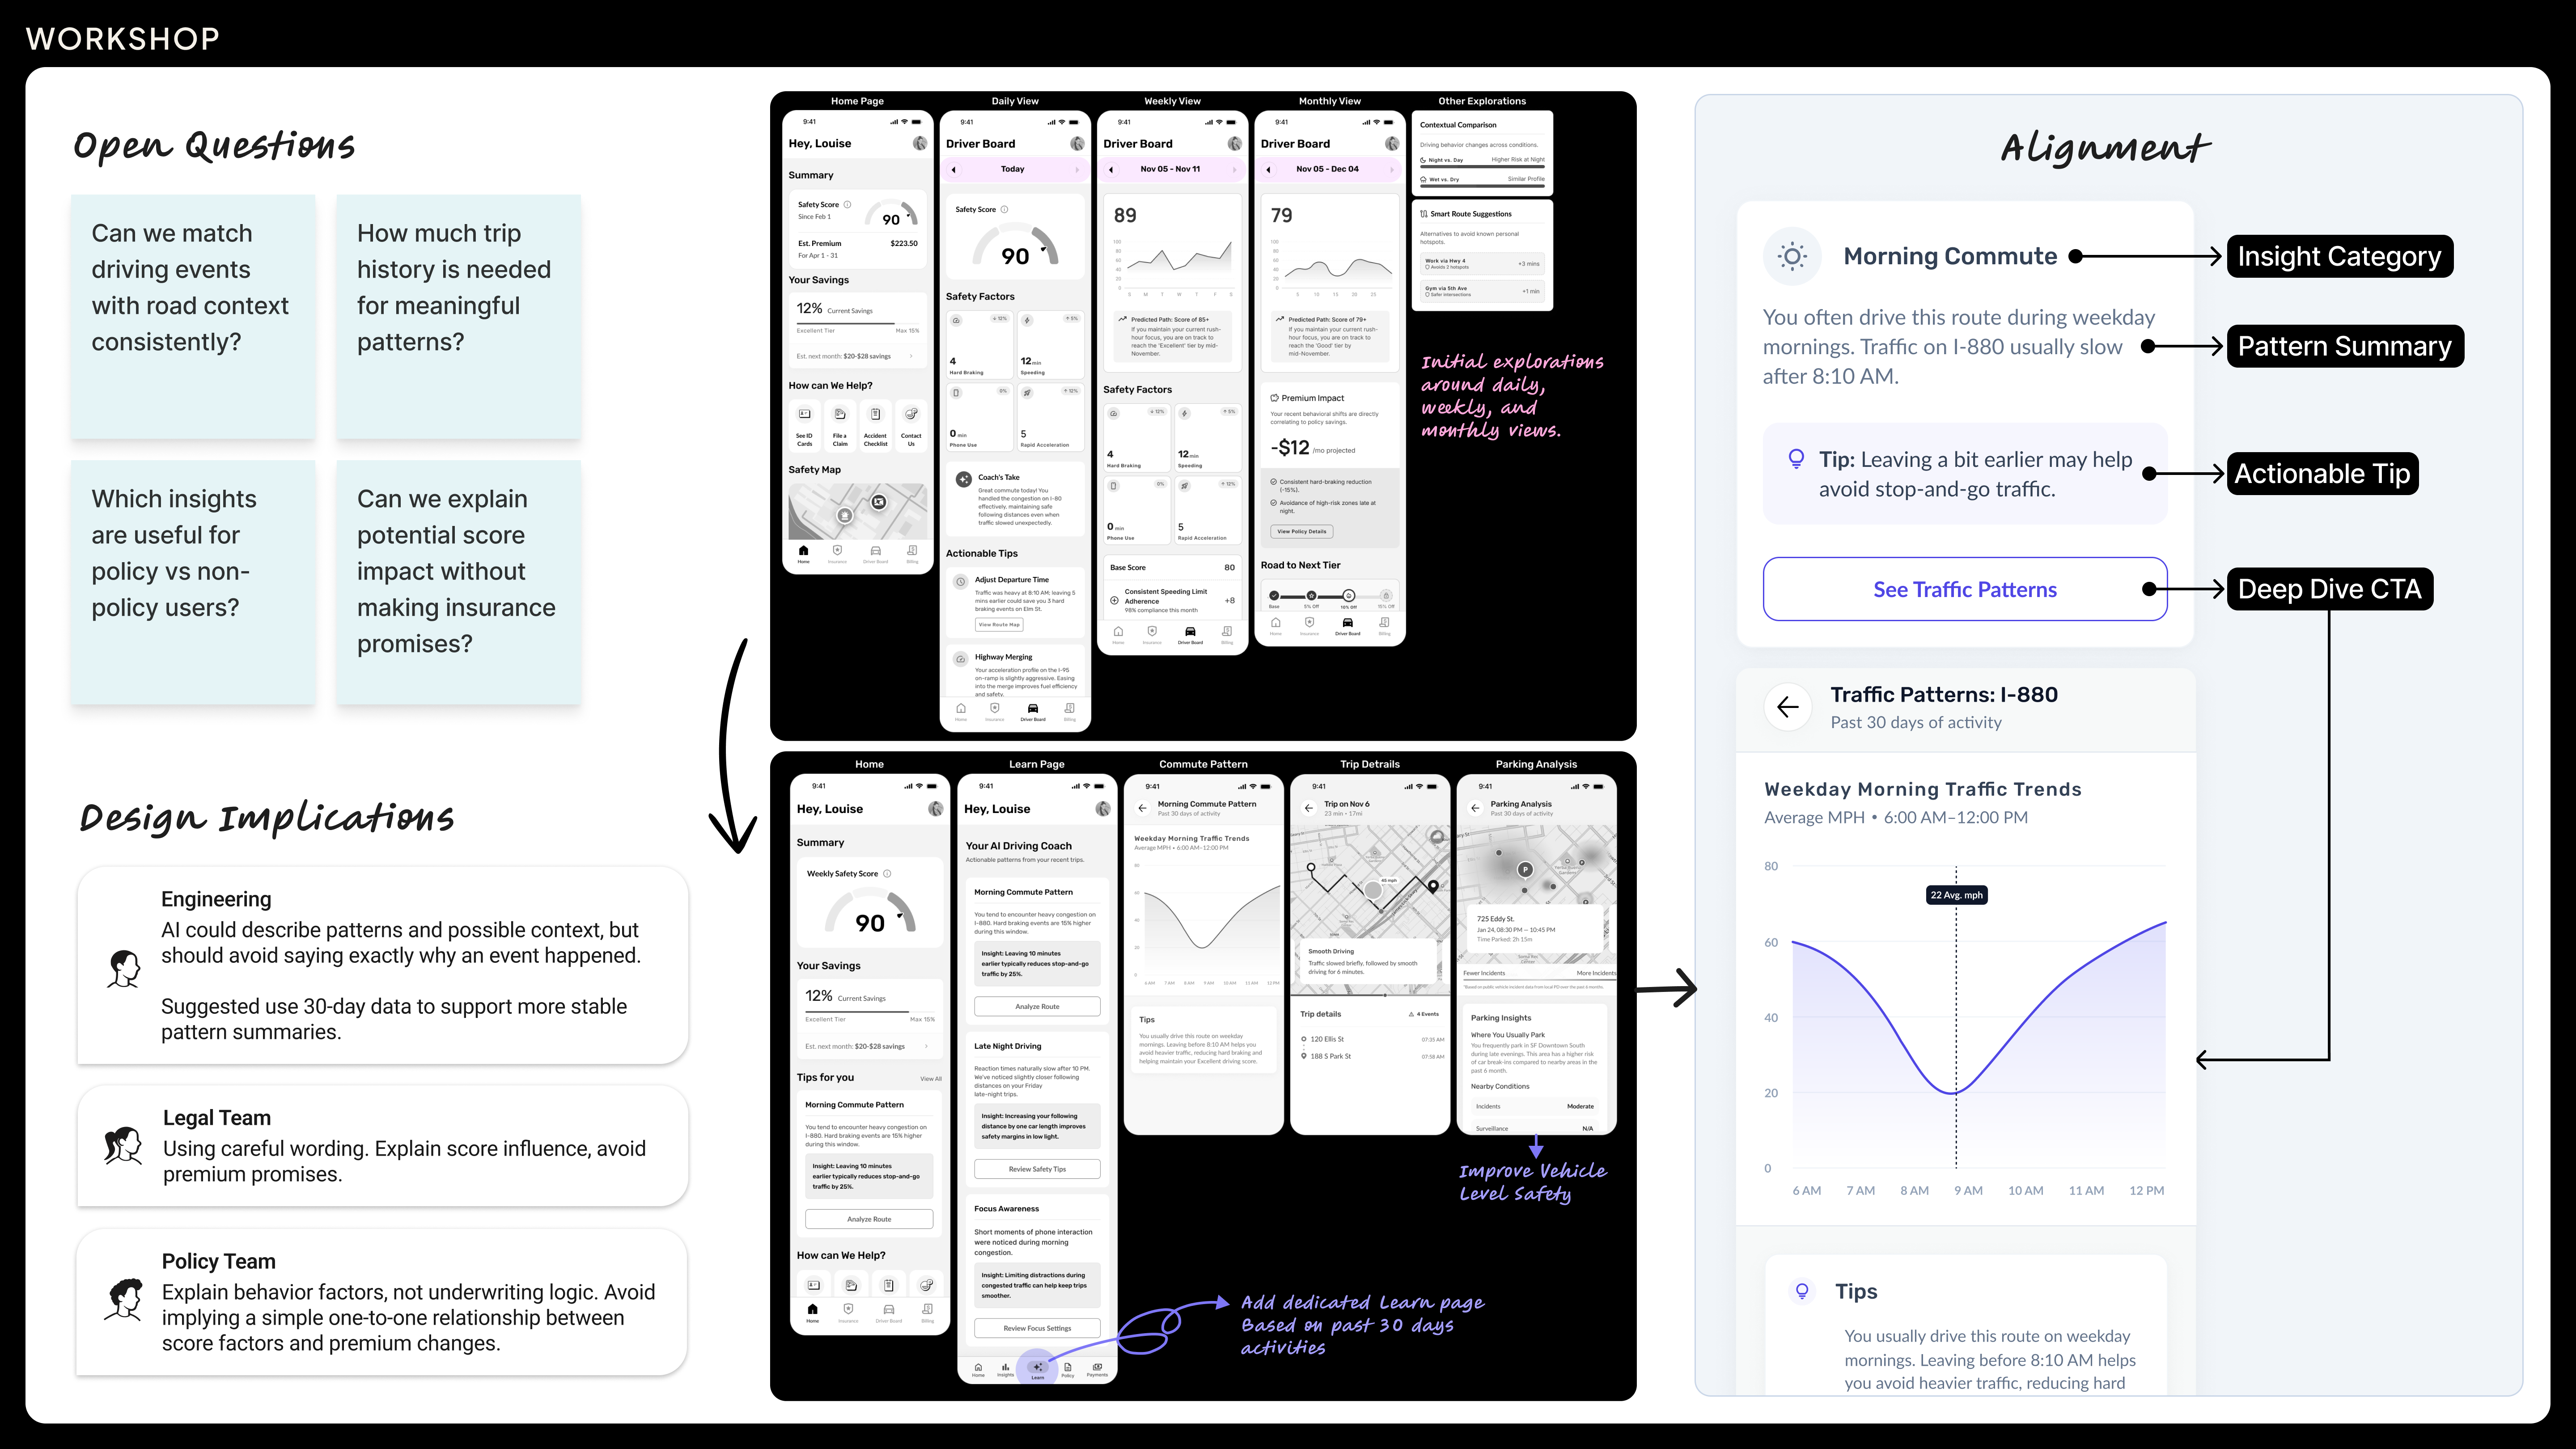
From defining the right problem to validating the approach and building alignment across the team.
Key Learnings
Research Insights
Users felt the data was disconnected from their real driving moments and context, so they didn’t know which behavior to change or how it affected their score.
Reliable Data
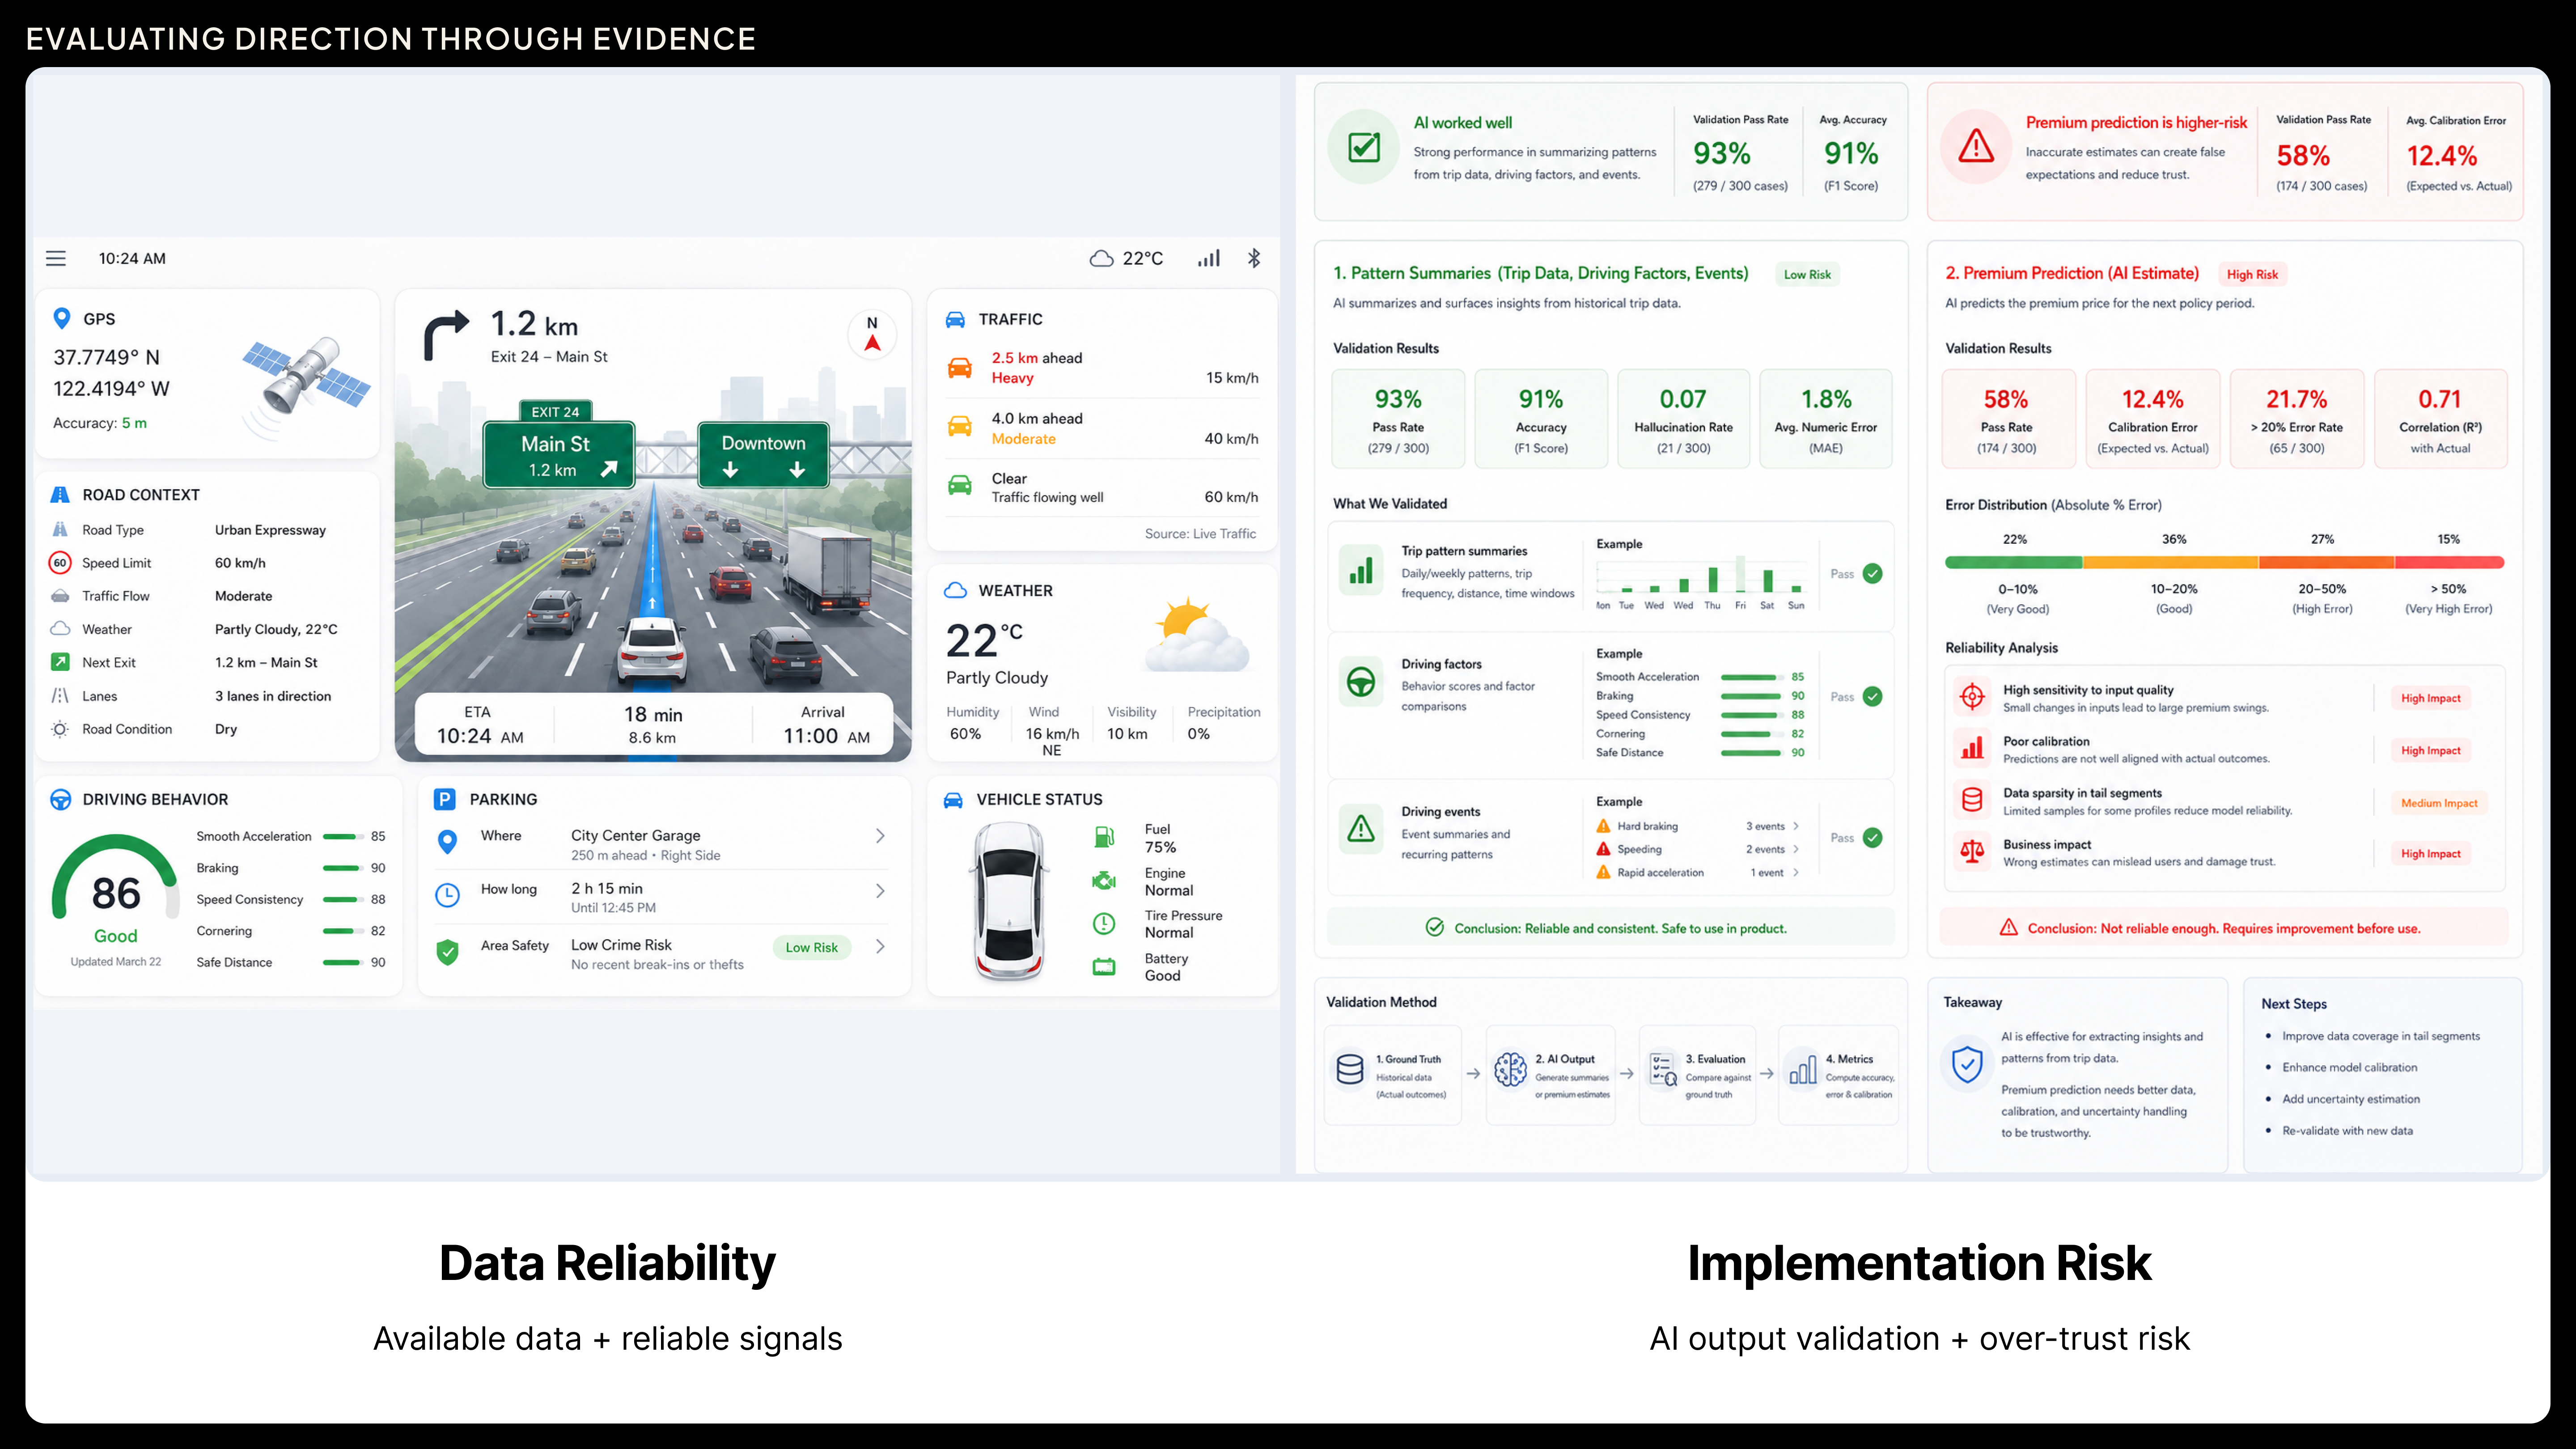
GPS, road context, traffic, weather, driving behavior, and parking data could support more contextual, trip-based insights.
AI Output Validation
AI worked well for summarizing patterns from trip data, driving factors, and driving events. Premium prediction was higher-risk because inaccurate estimates could create false expectations and reduce trust.
Product Direction
Use AI as an interpretation layer
Rather than simply presenting driving data or scores, the experience uses AI to translate driving patterns into understandable insights and actionable guidance.
Data Sources
Trip data Driving events Road context Weather data
Data Processing & Contextualization
Detect driving events Match road, route, time, and weather Calculate trip metrics
Structured Driving Signals
Event frequency Behavioral trends Driving factors Risk indicators Trip comparisons
AI Interpretation Layer
Summarize patterns Explain contributing factors Translate data into clear takeaways Personalize recommendations
Driver Insights & Coaching
Pattern summaries Actionable tips Behavior improvement guidance
From Driving Data to Better Decisions
Explore intelligent tools designed to help you save smarter, spend wiser, and stay in full control.
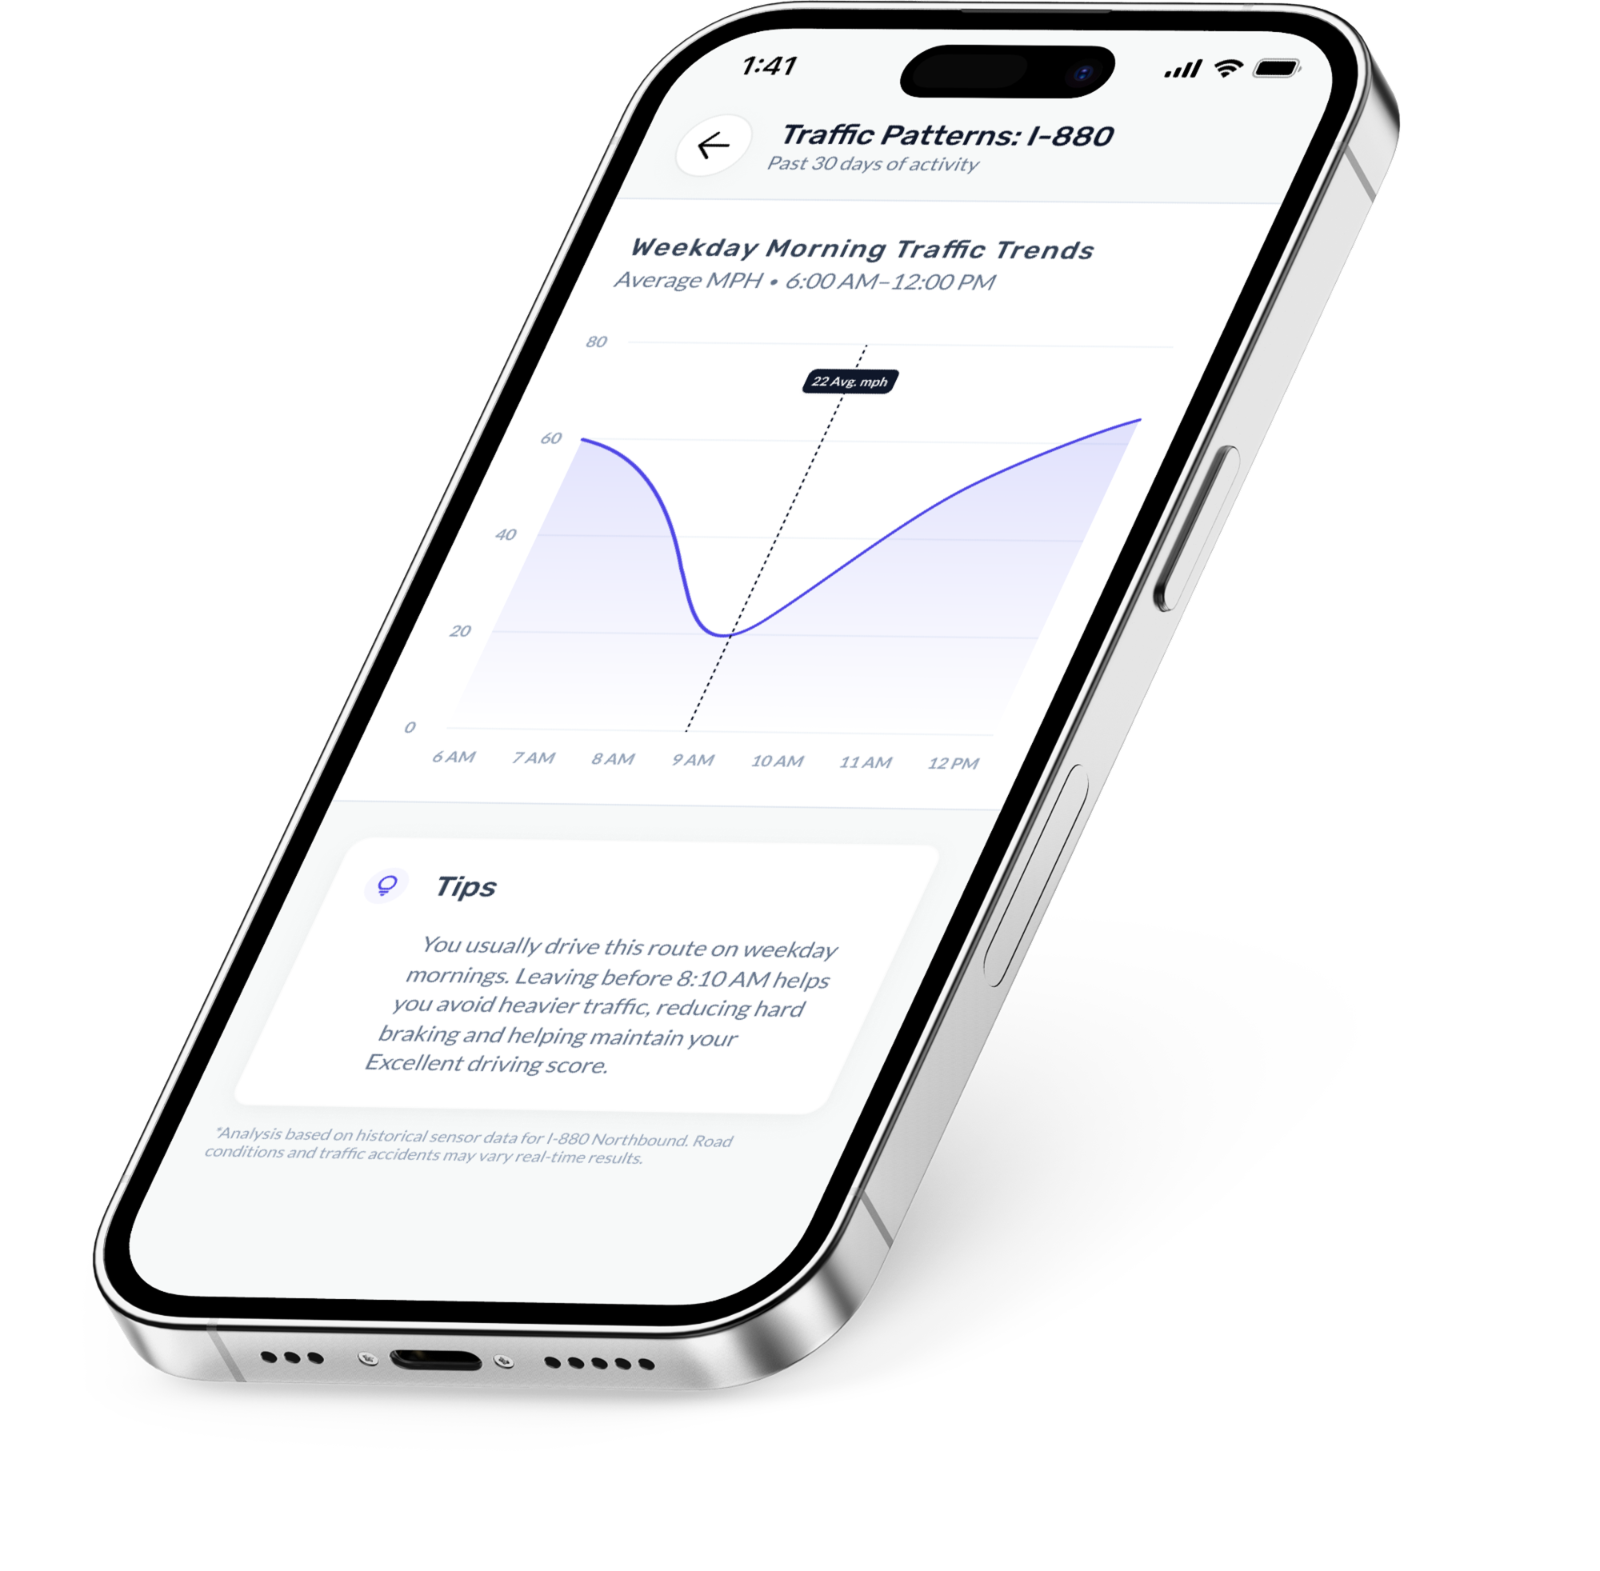
Learn how traffic affects your routine.
Understand how traffic shapes your daily drives, so you can plan better and avoid more stressful trips.
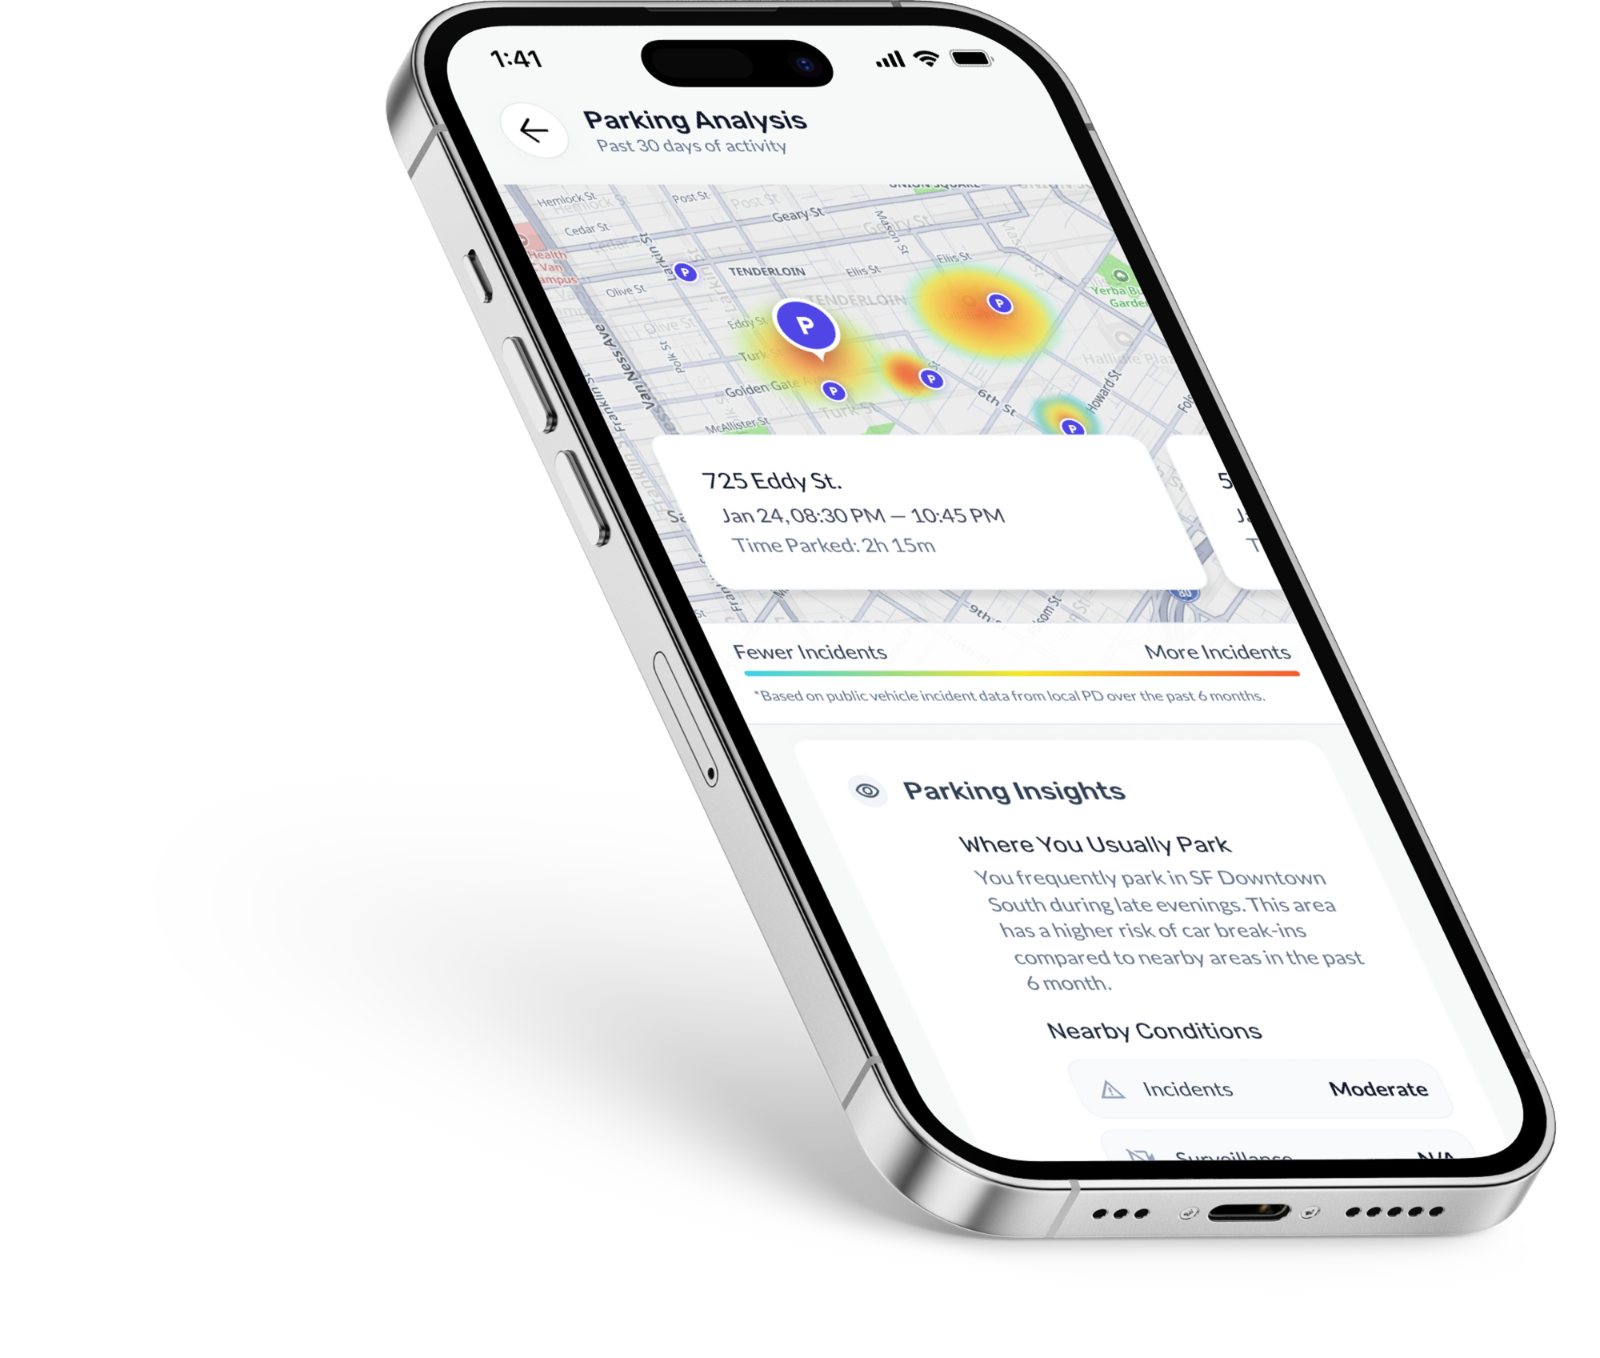
Insights from your parking history.
Review where you’ve parked most often and see location-based risk patterns, helping you make safer choices over time.
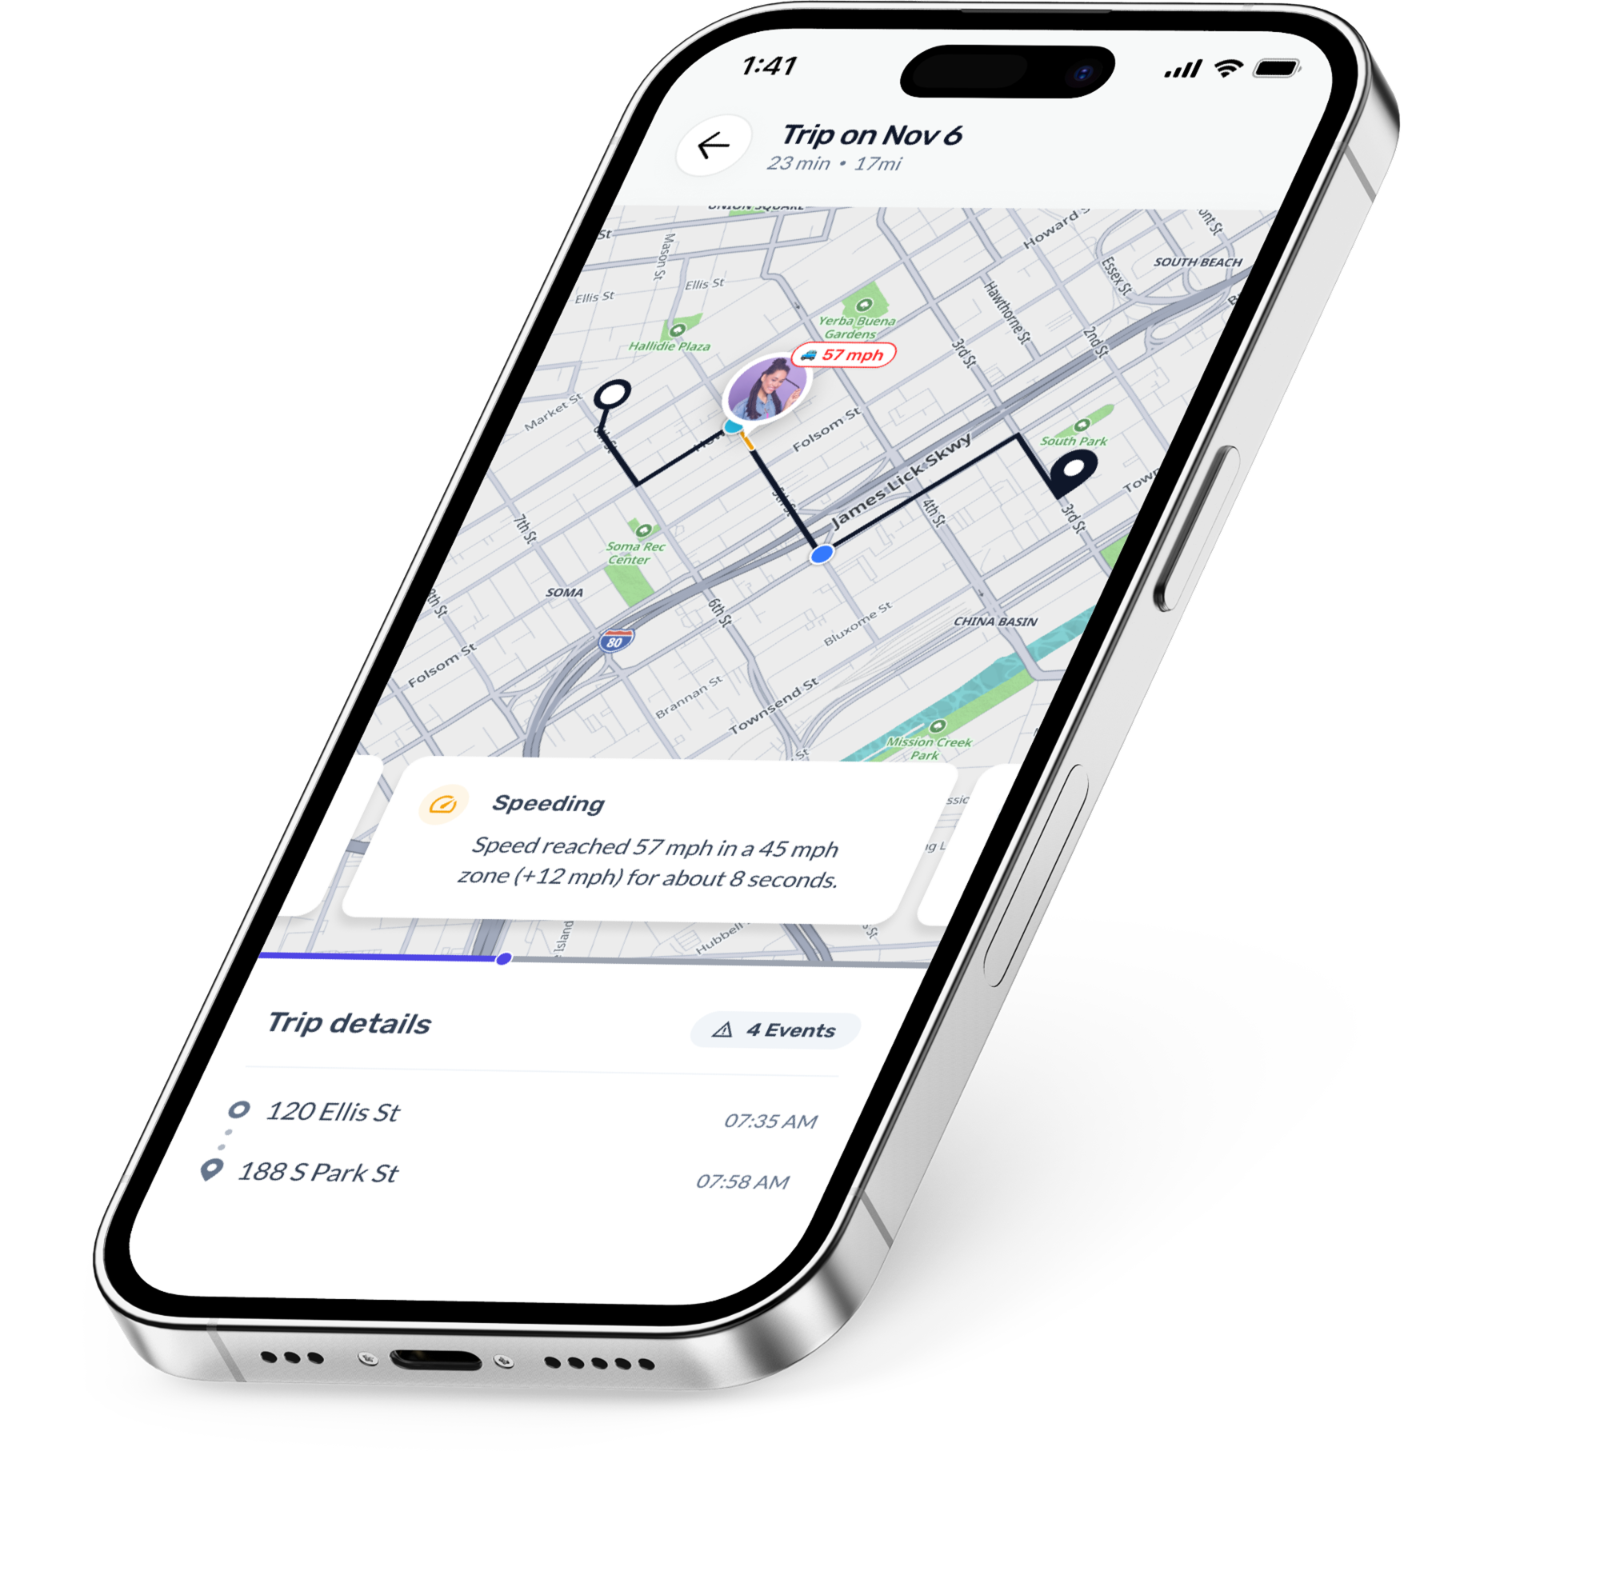
Replay your drive. See what really happened.
Visual trip playback shows key moments with live speed and road context, turning abstract scores into real driving experiences.
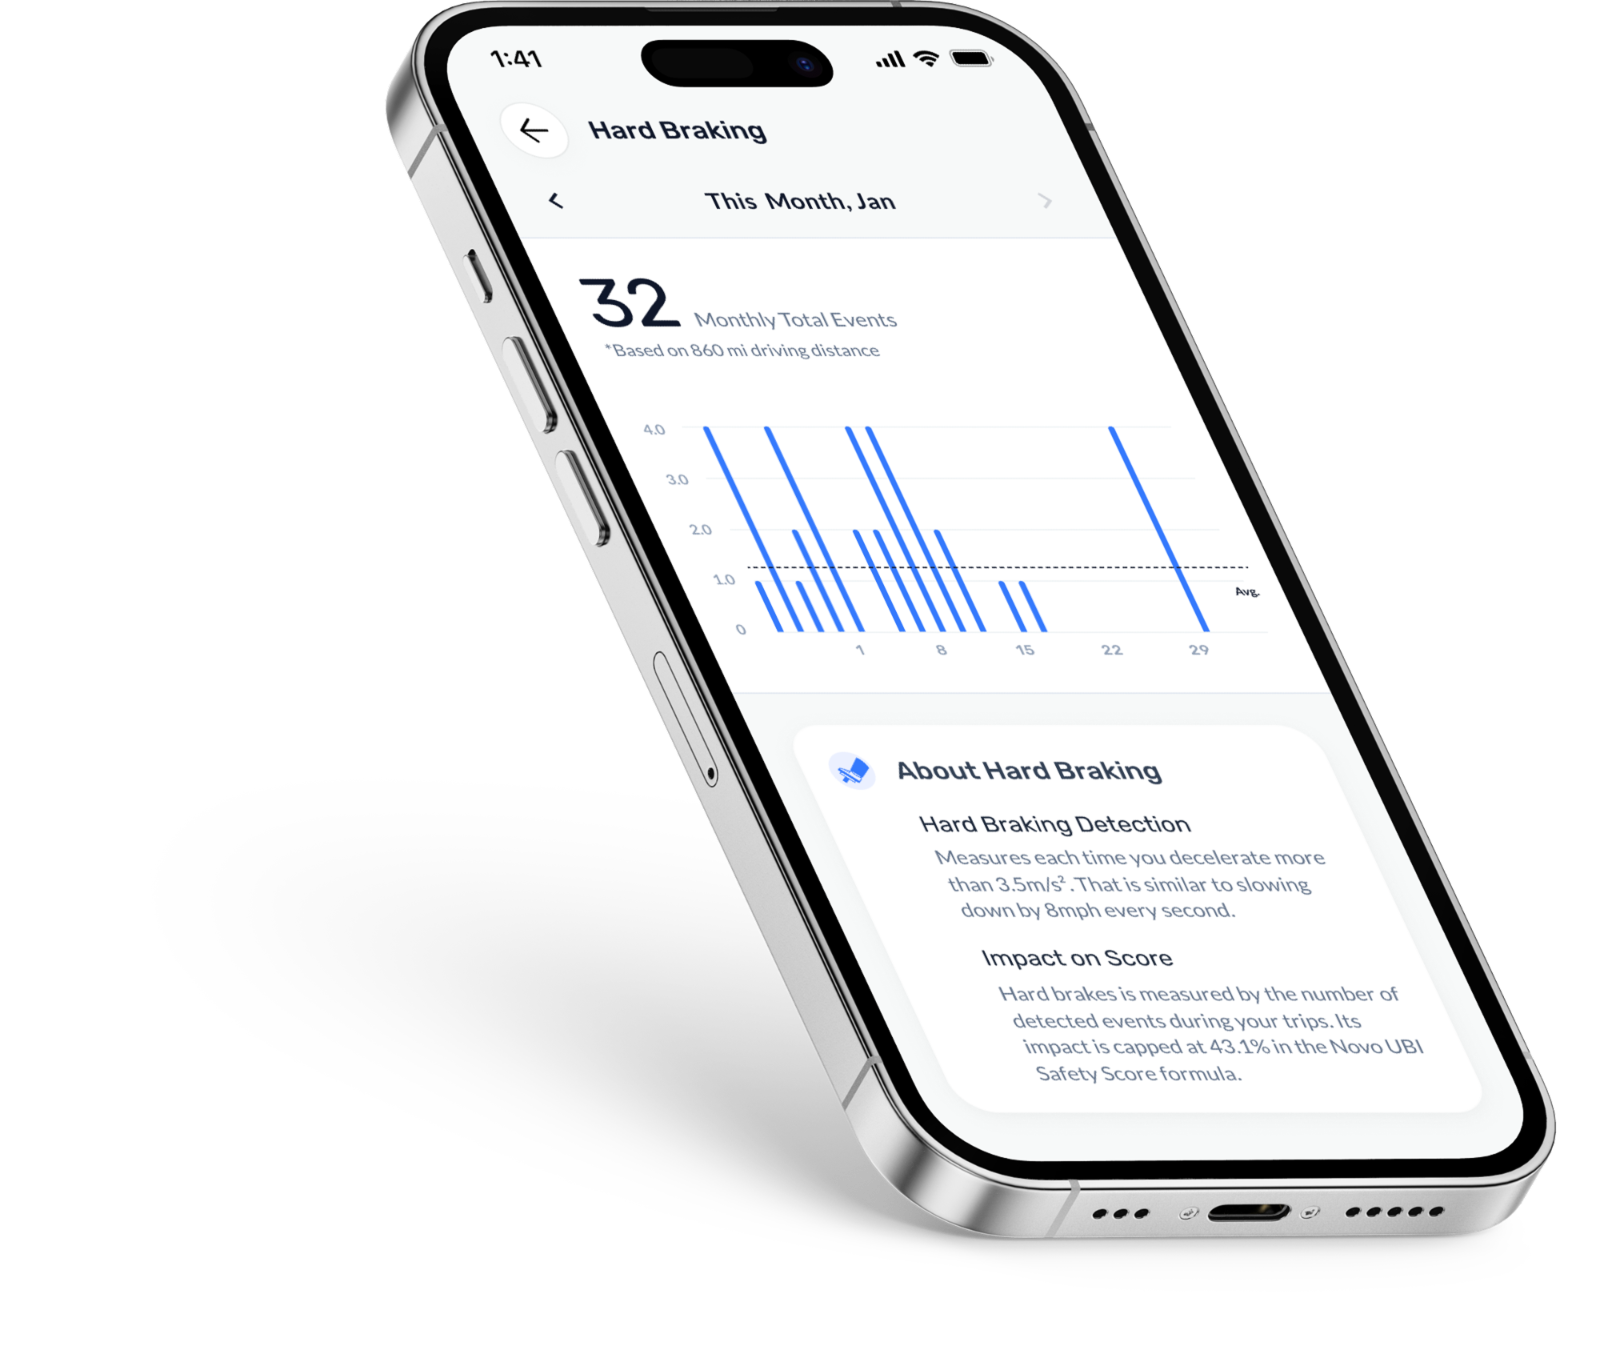
See your driving patterns at a glance.
Daily, weekly, and monthly views highlight speeding, braking, acceleration, and phone use, making it easy to spot trends and understand what affects your score.
Considerations & Trade-offs
Rather than positioning AI as a driving coach, the system acts as a supportive interpreter, helping users understand the cause-and-effect between behavior and insurance costs.
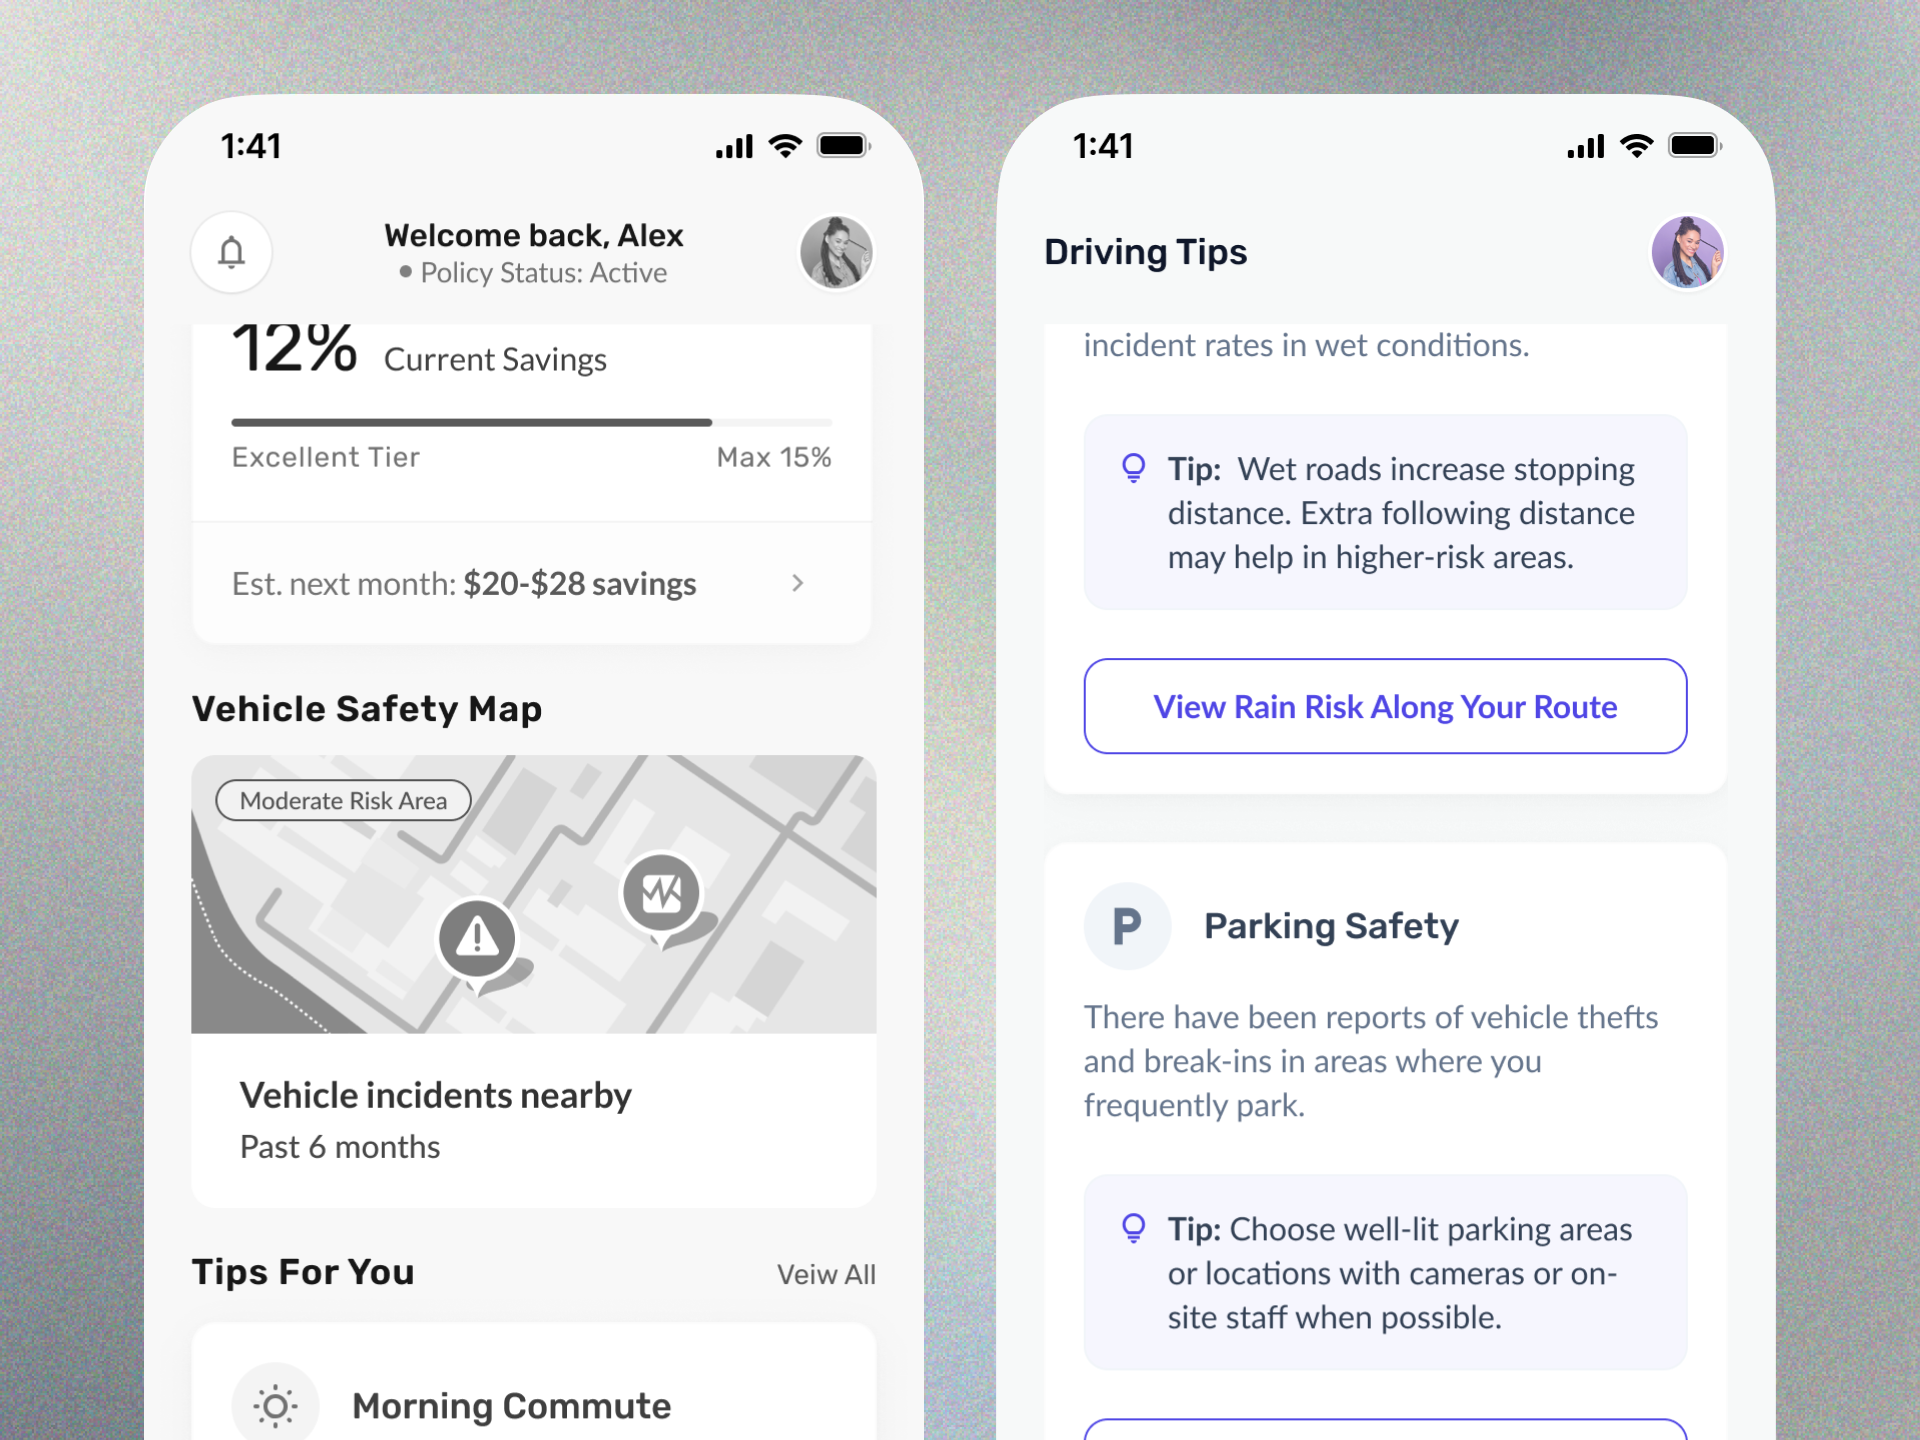
Vehicle Safety Map vs. Parking Insights
Rather than adding a live safety map to the homepage, we kept vehicle safety within Parking Insights—where recommendations could be grounded in the vehicle’s actual parking history.
The final direction made vehicle safety guidance more relevant and accurate by connecting it to users’ actual parking behavior rather than a generic live map.
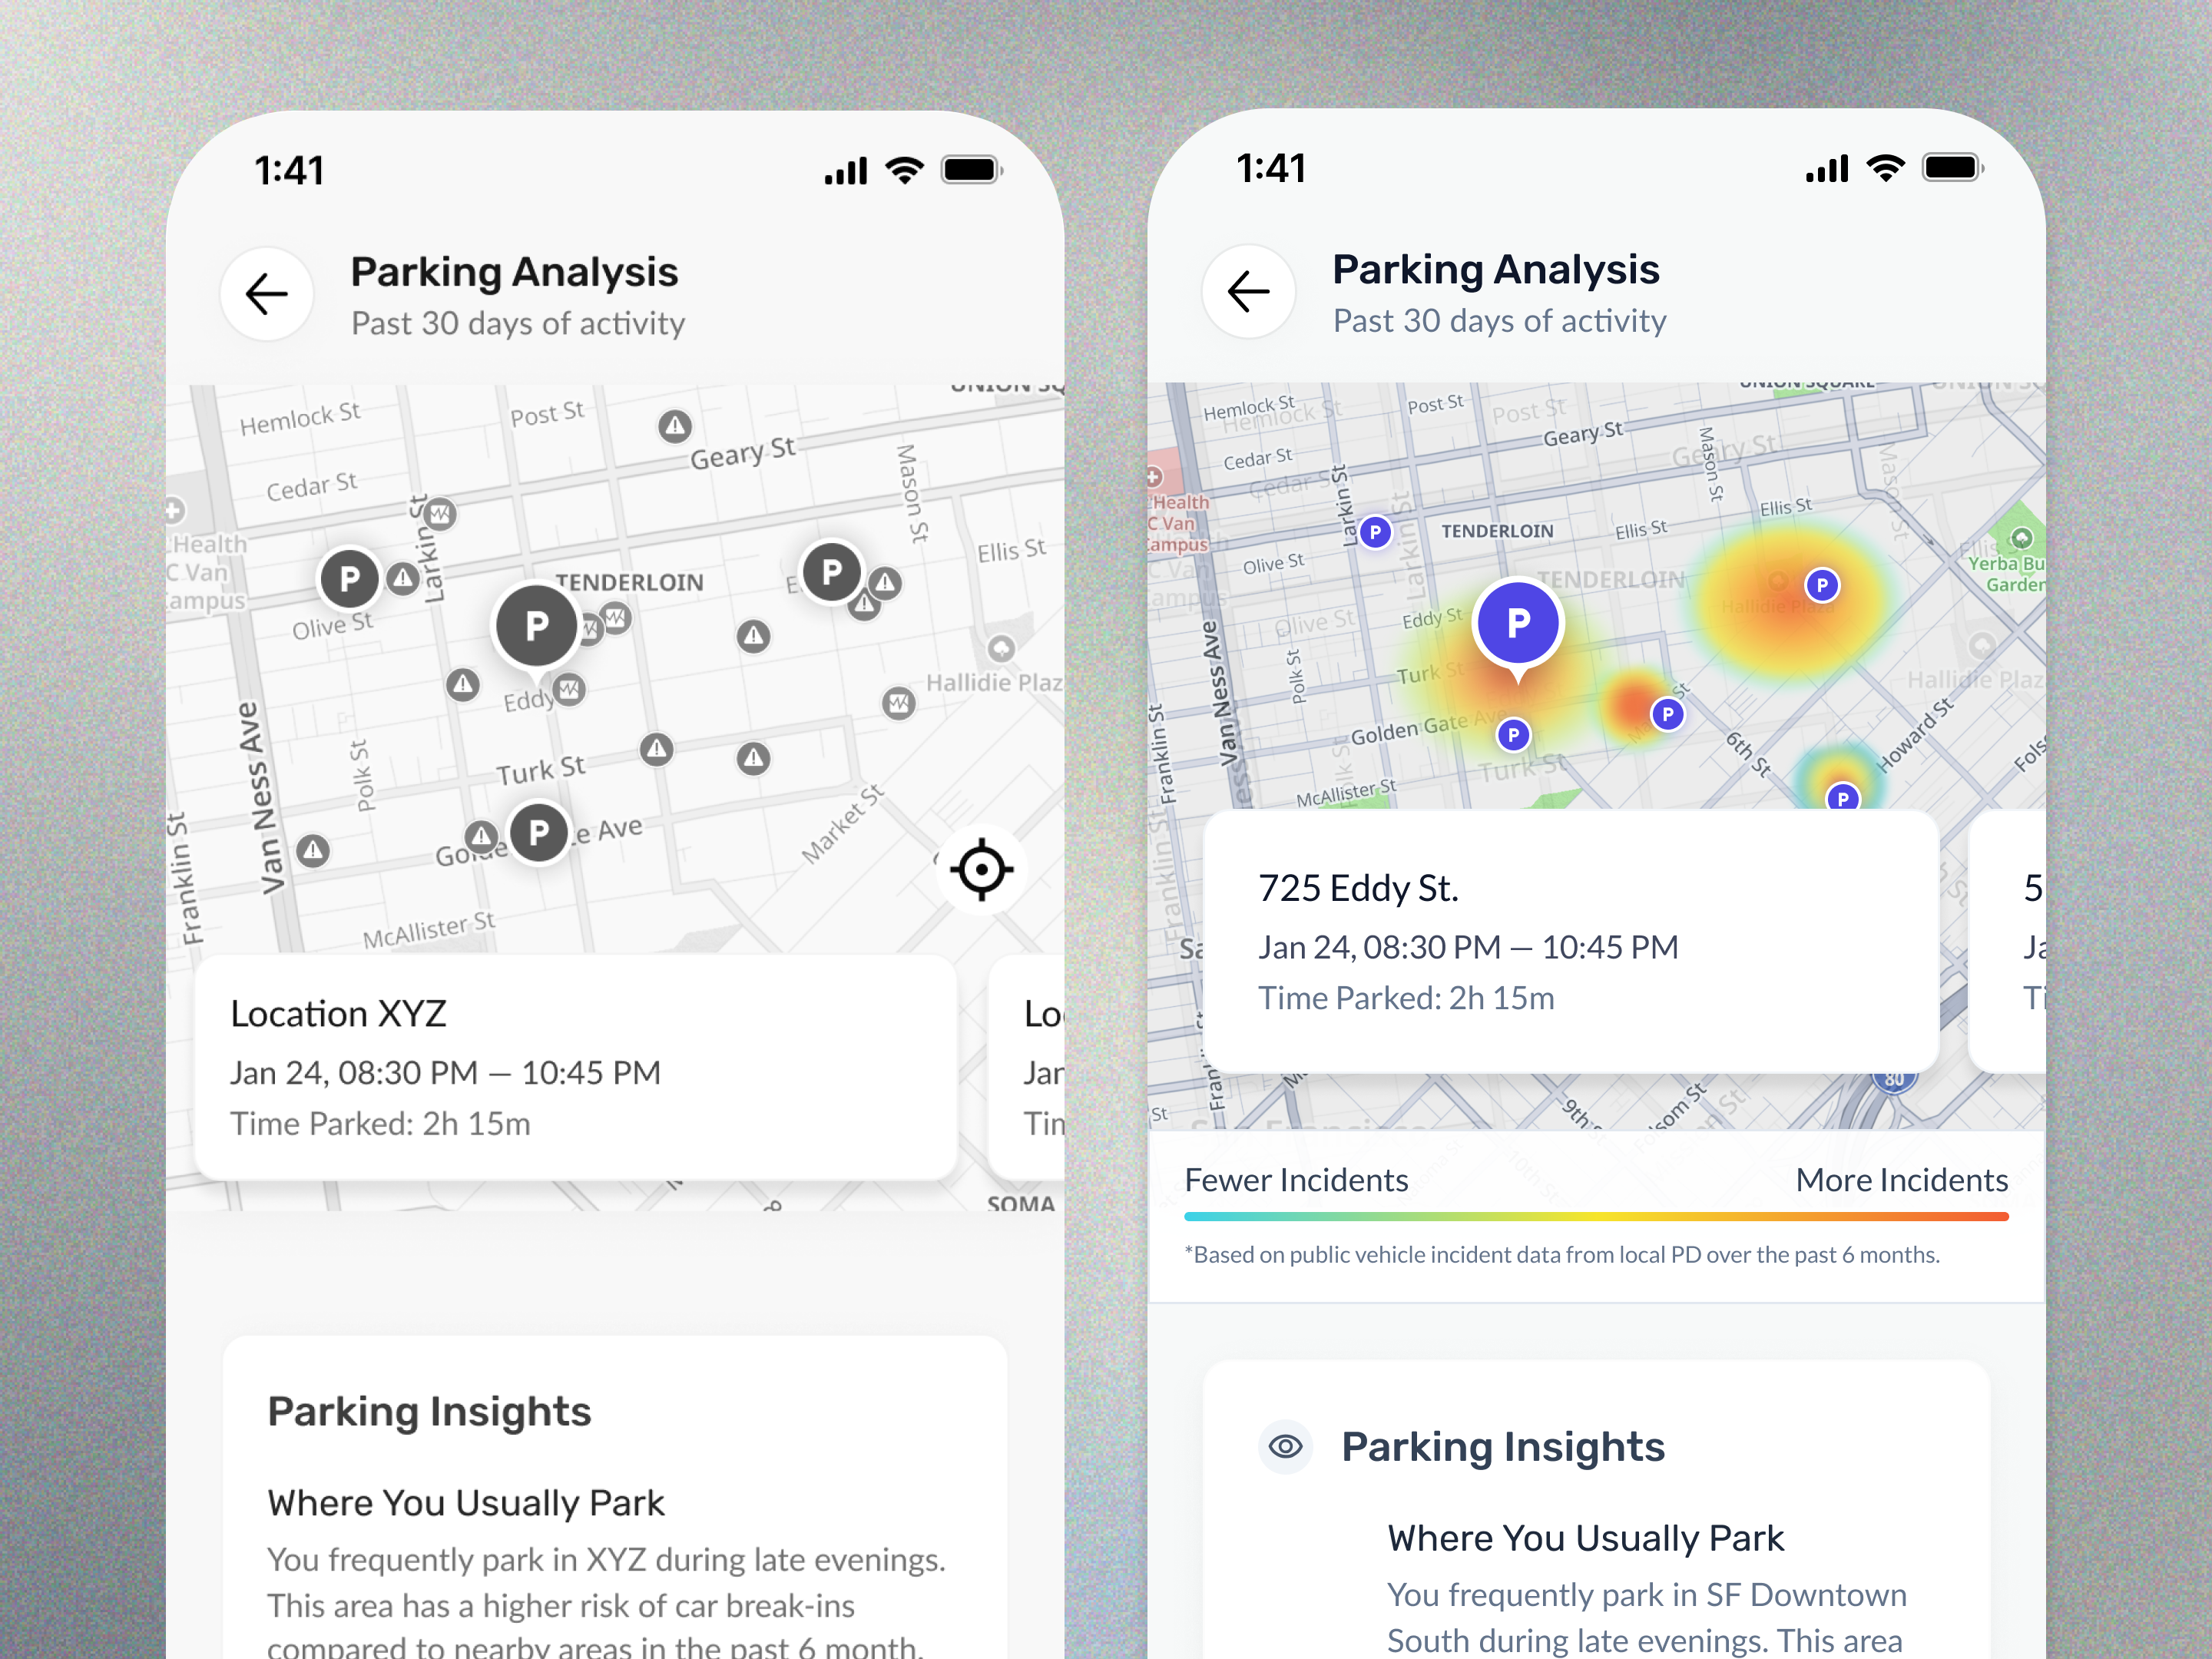
Incident Pins vs. Heat Map
Displaying every incident created visual clutter and required live data loading. We explored a heat map to communicate incident density more clearly and efficiently.
We replaced individual incident pins with a heat map, making high-risk areas easier to understand while reducing visual noise and improving map performance.
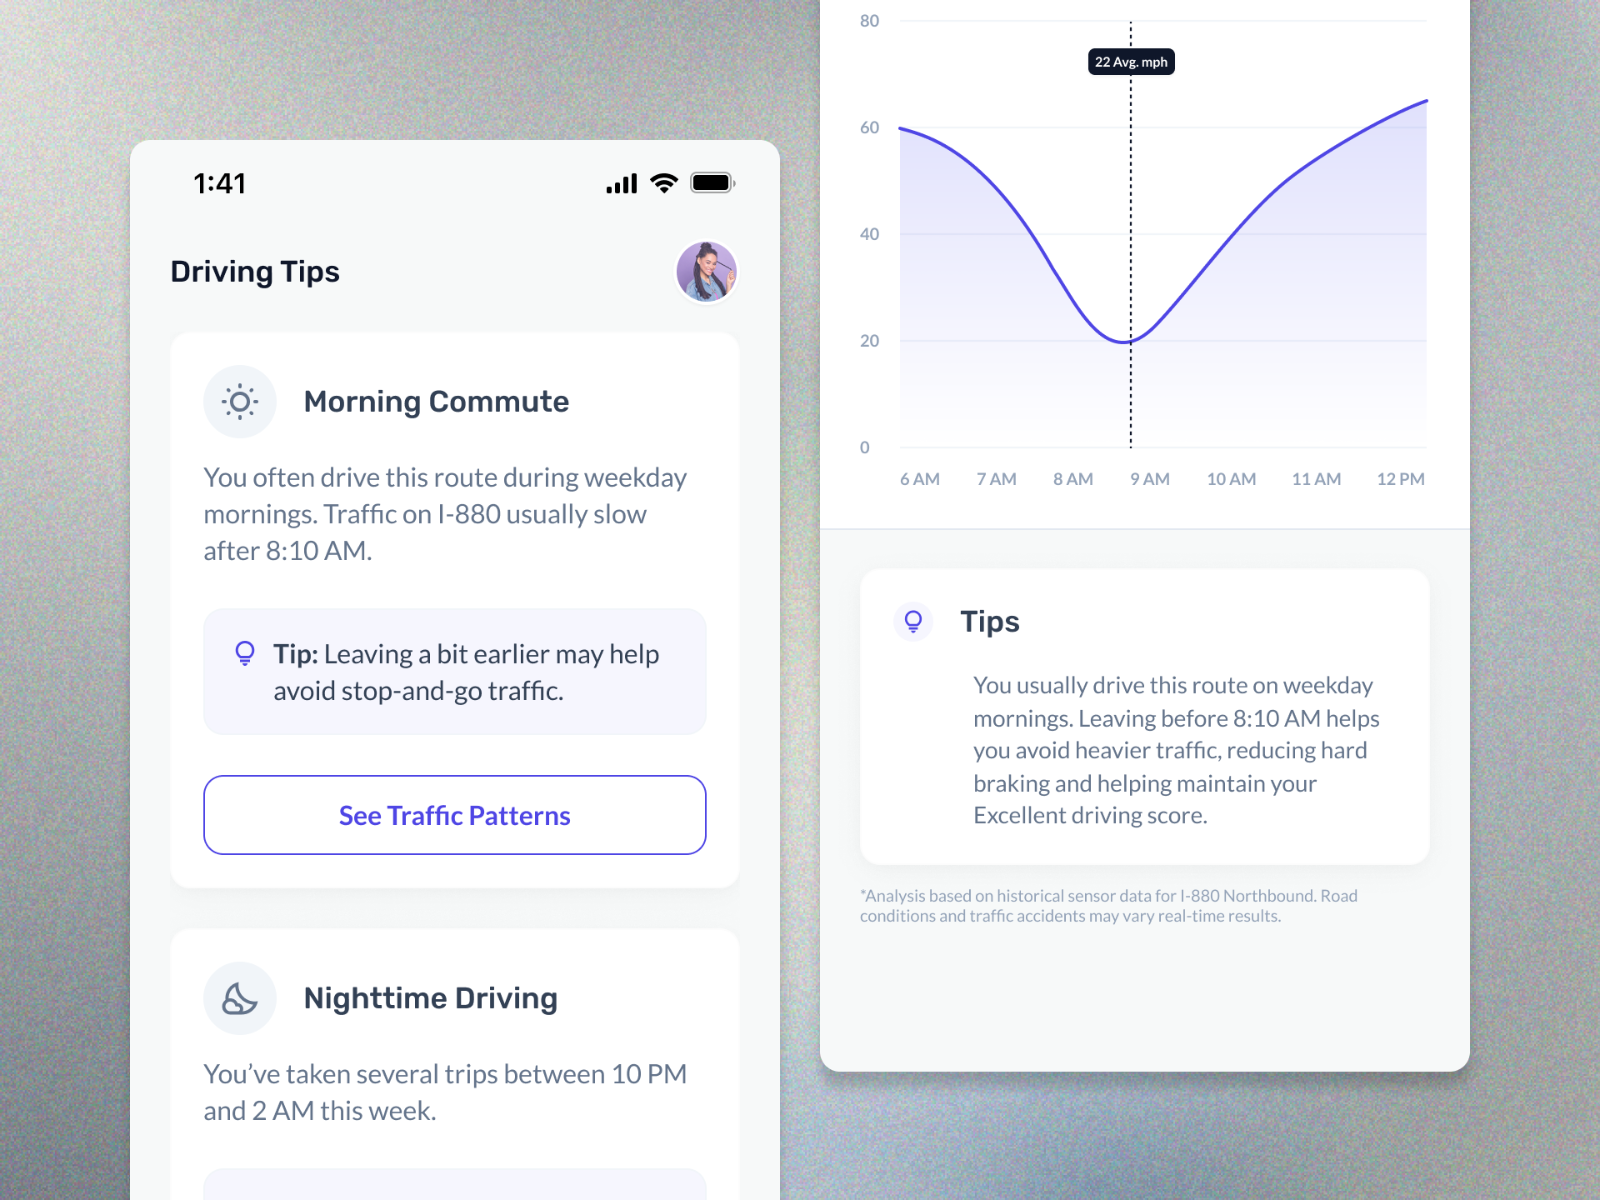
Embedding AI into existing workflows
Placing AI inside Driving Insights, Trip Replay, and Learn avoids introducing a separate “AI mode.”
Users discovered AI insights naturally while reviewing their trips, leading to higher engagement without adding learning friction.
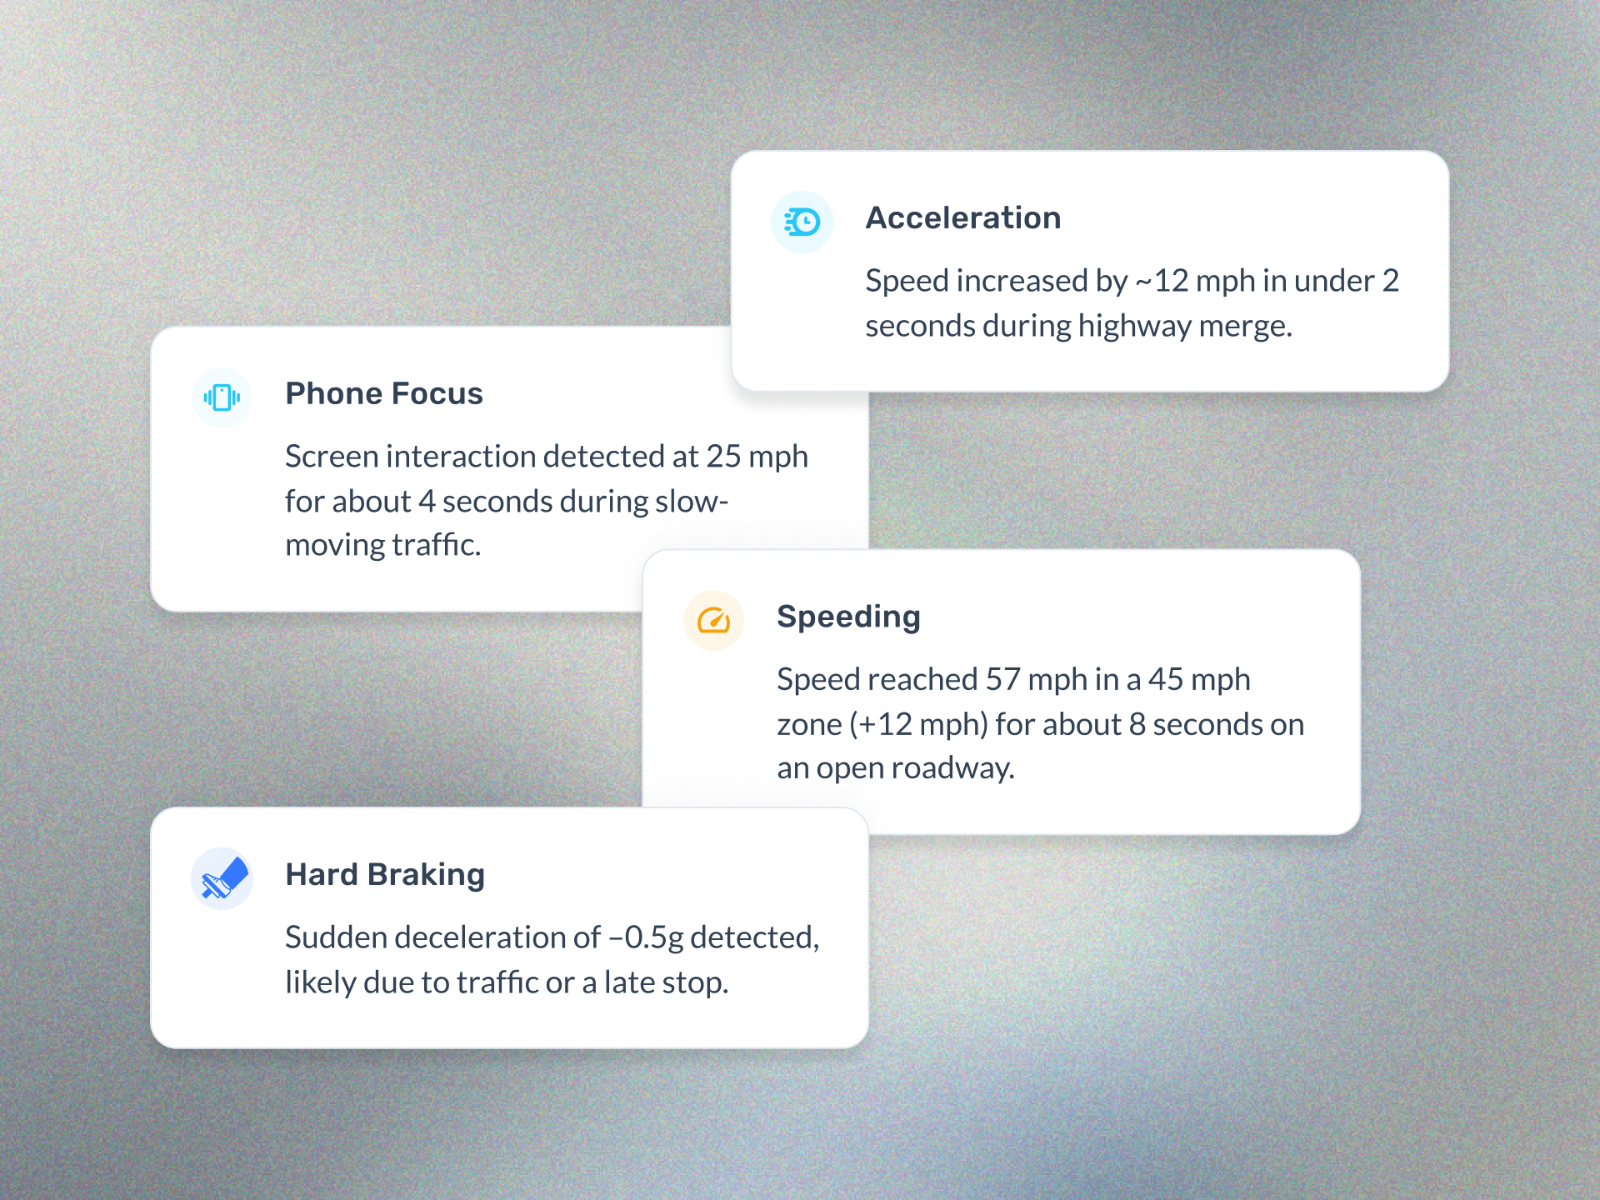
Adding context reframes blame into understanding
Pairing events with traffic, weather, and road context helps users see contributing factors.
Driving feedback feels more credible and easier to reflect on, helping users connect their behavior with real-world conditions.
Final Design Overview
Embedding AI into an existing Usage-Based Insurance (UBI) product to transform driving data into transparent, actionable insights helping users understand how their behavior impacts insurance costs while supporting safer driving decisions.
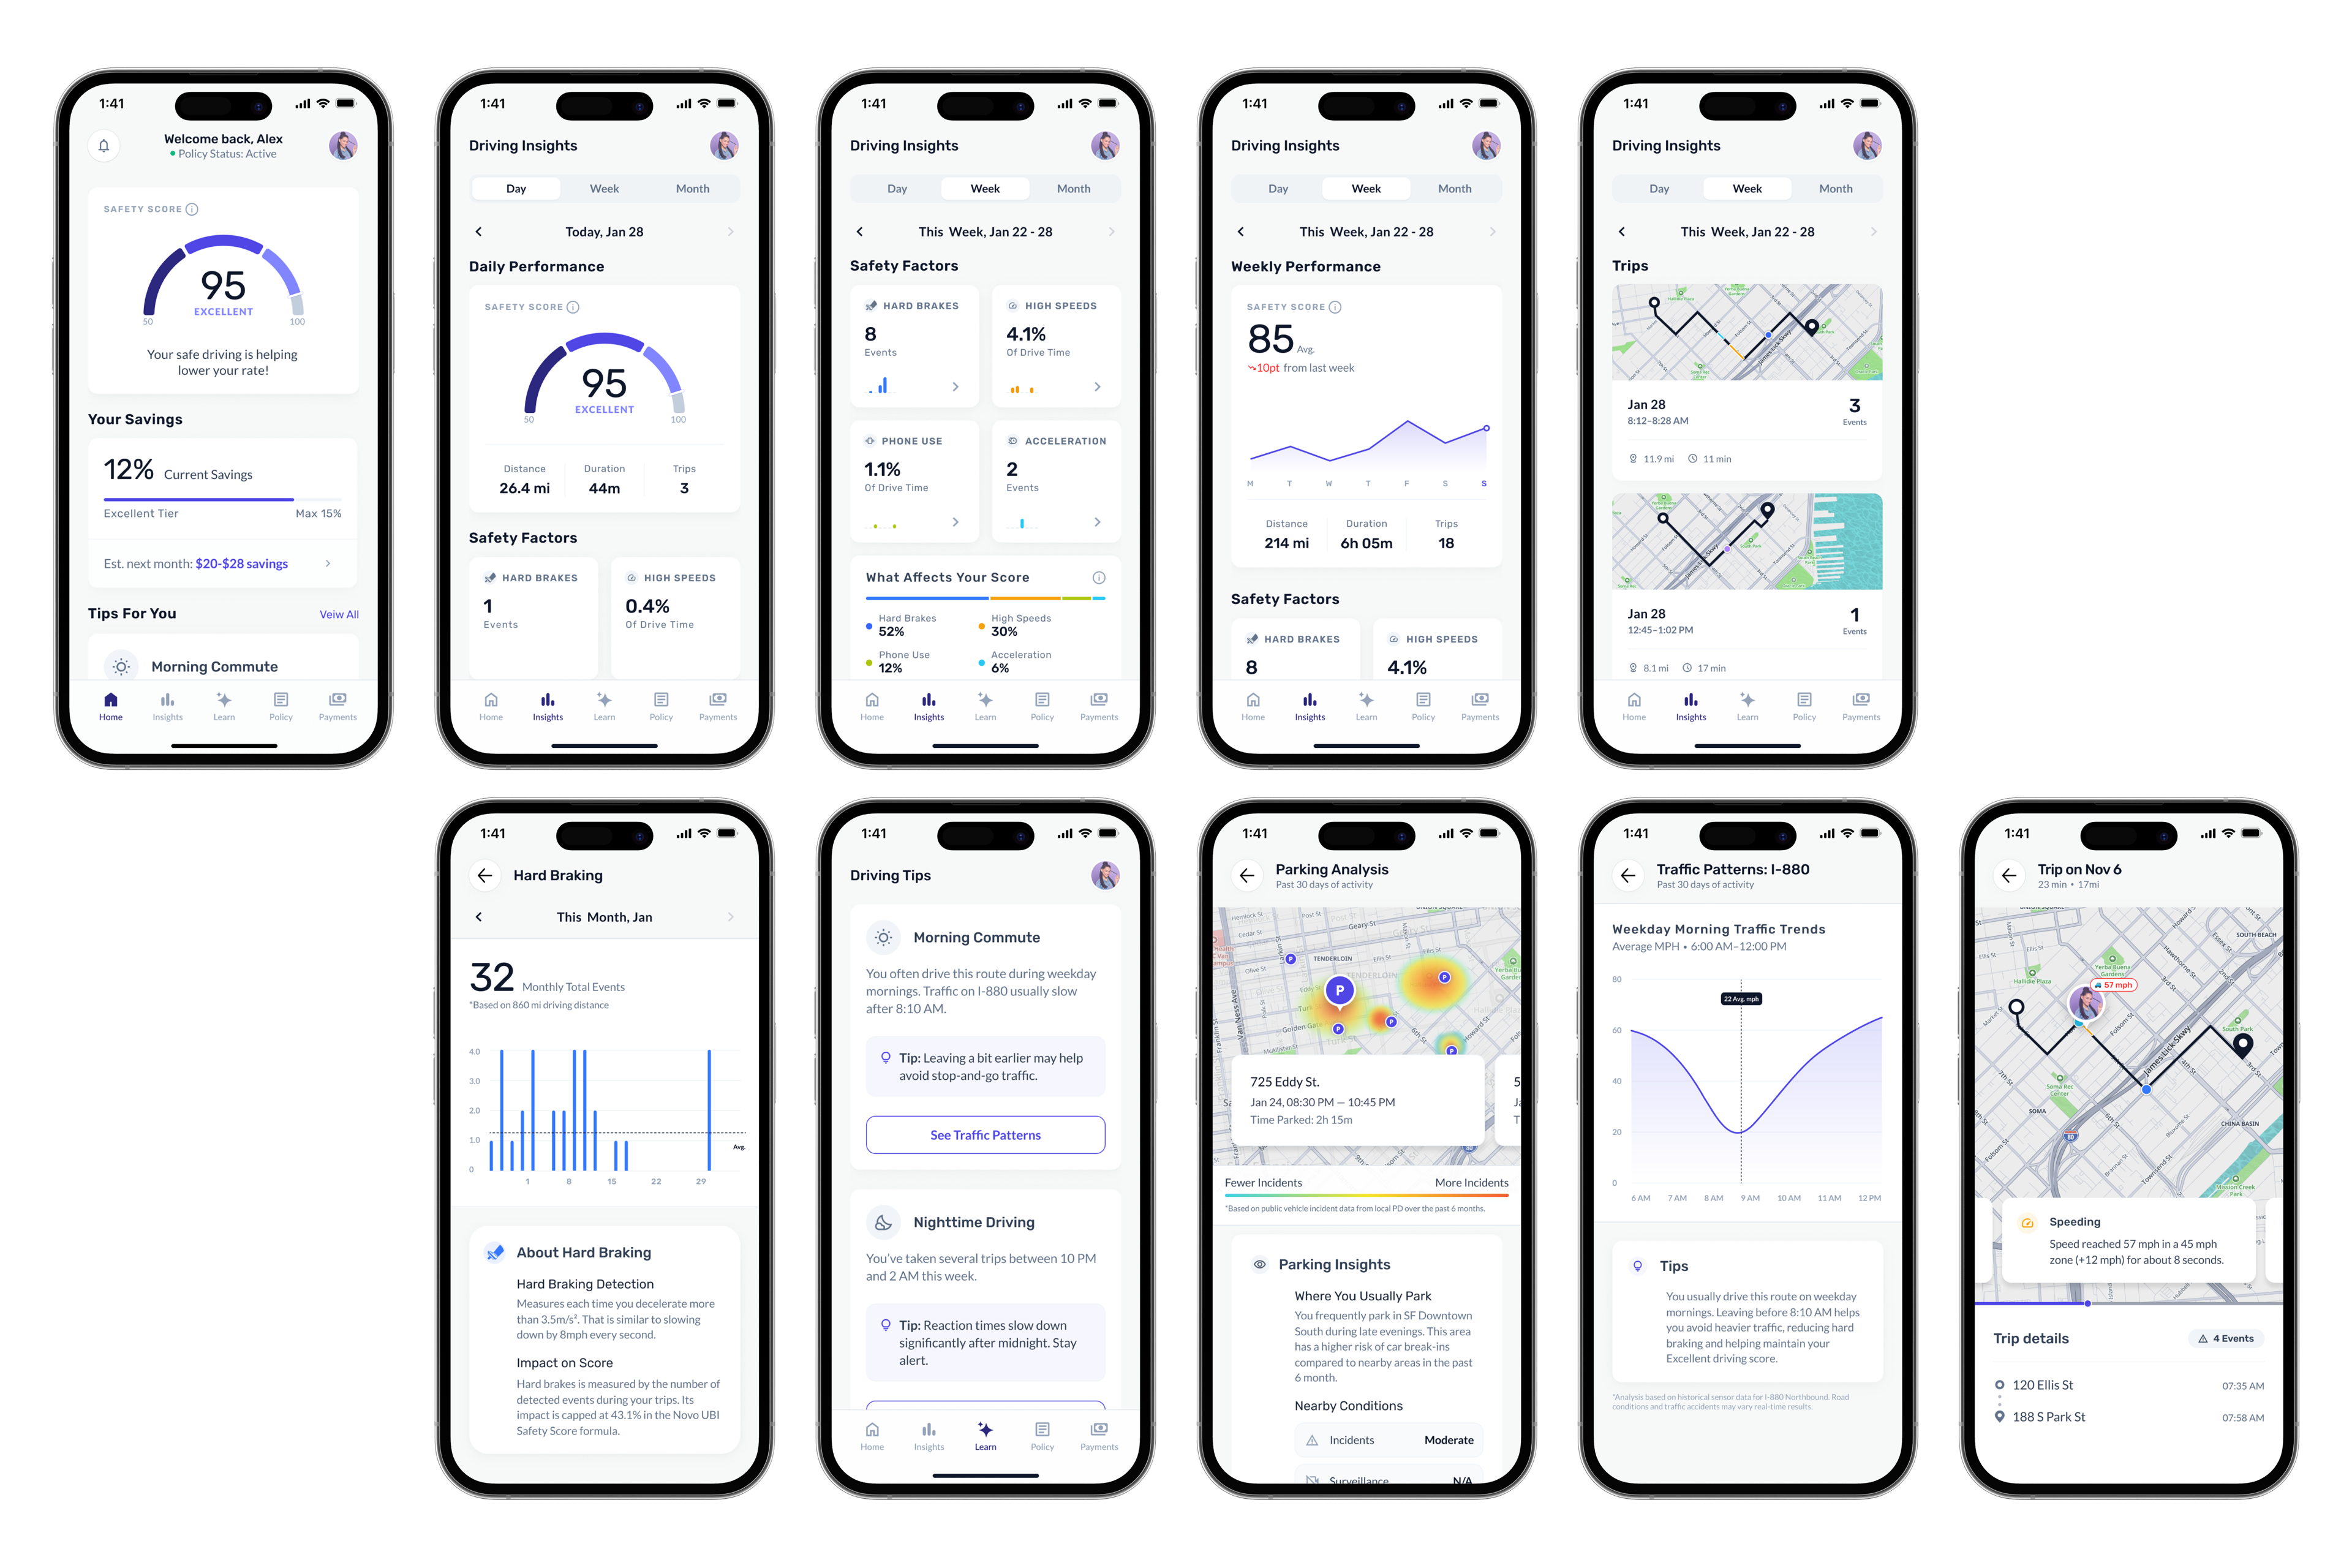
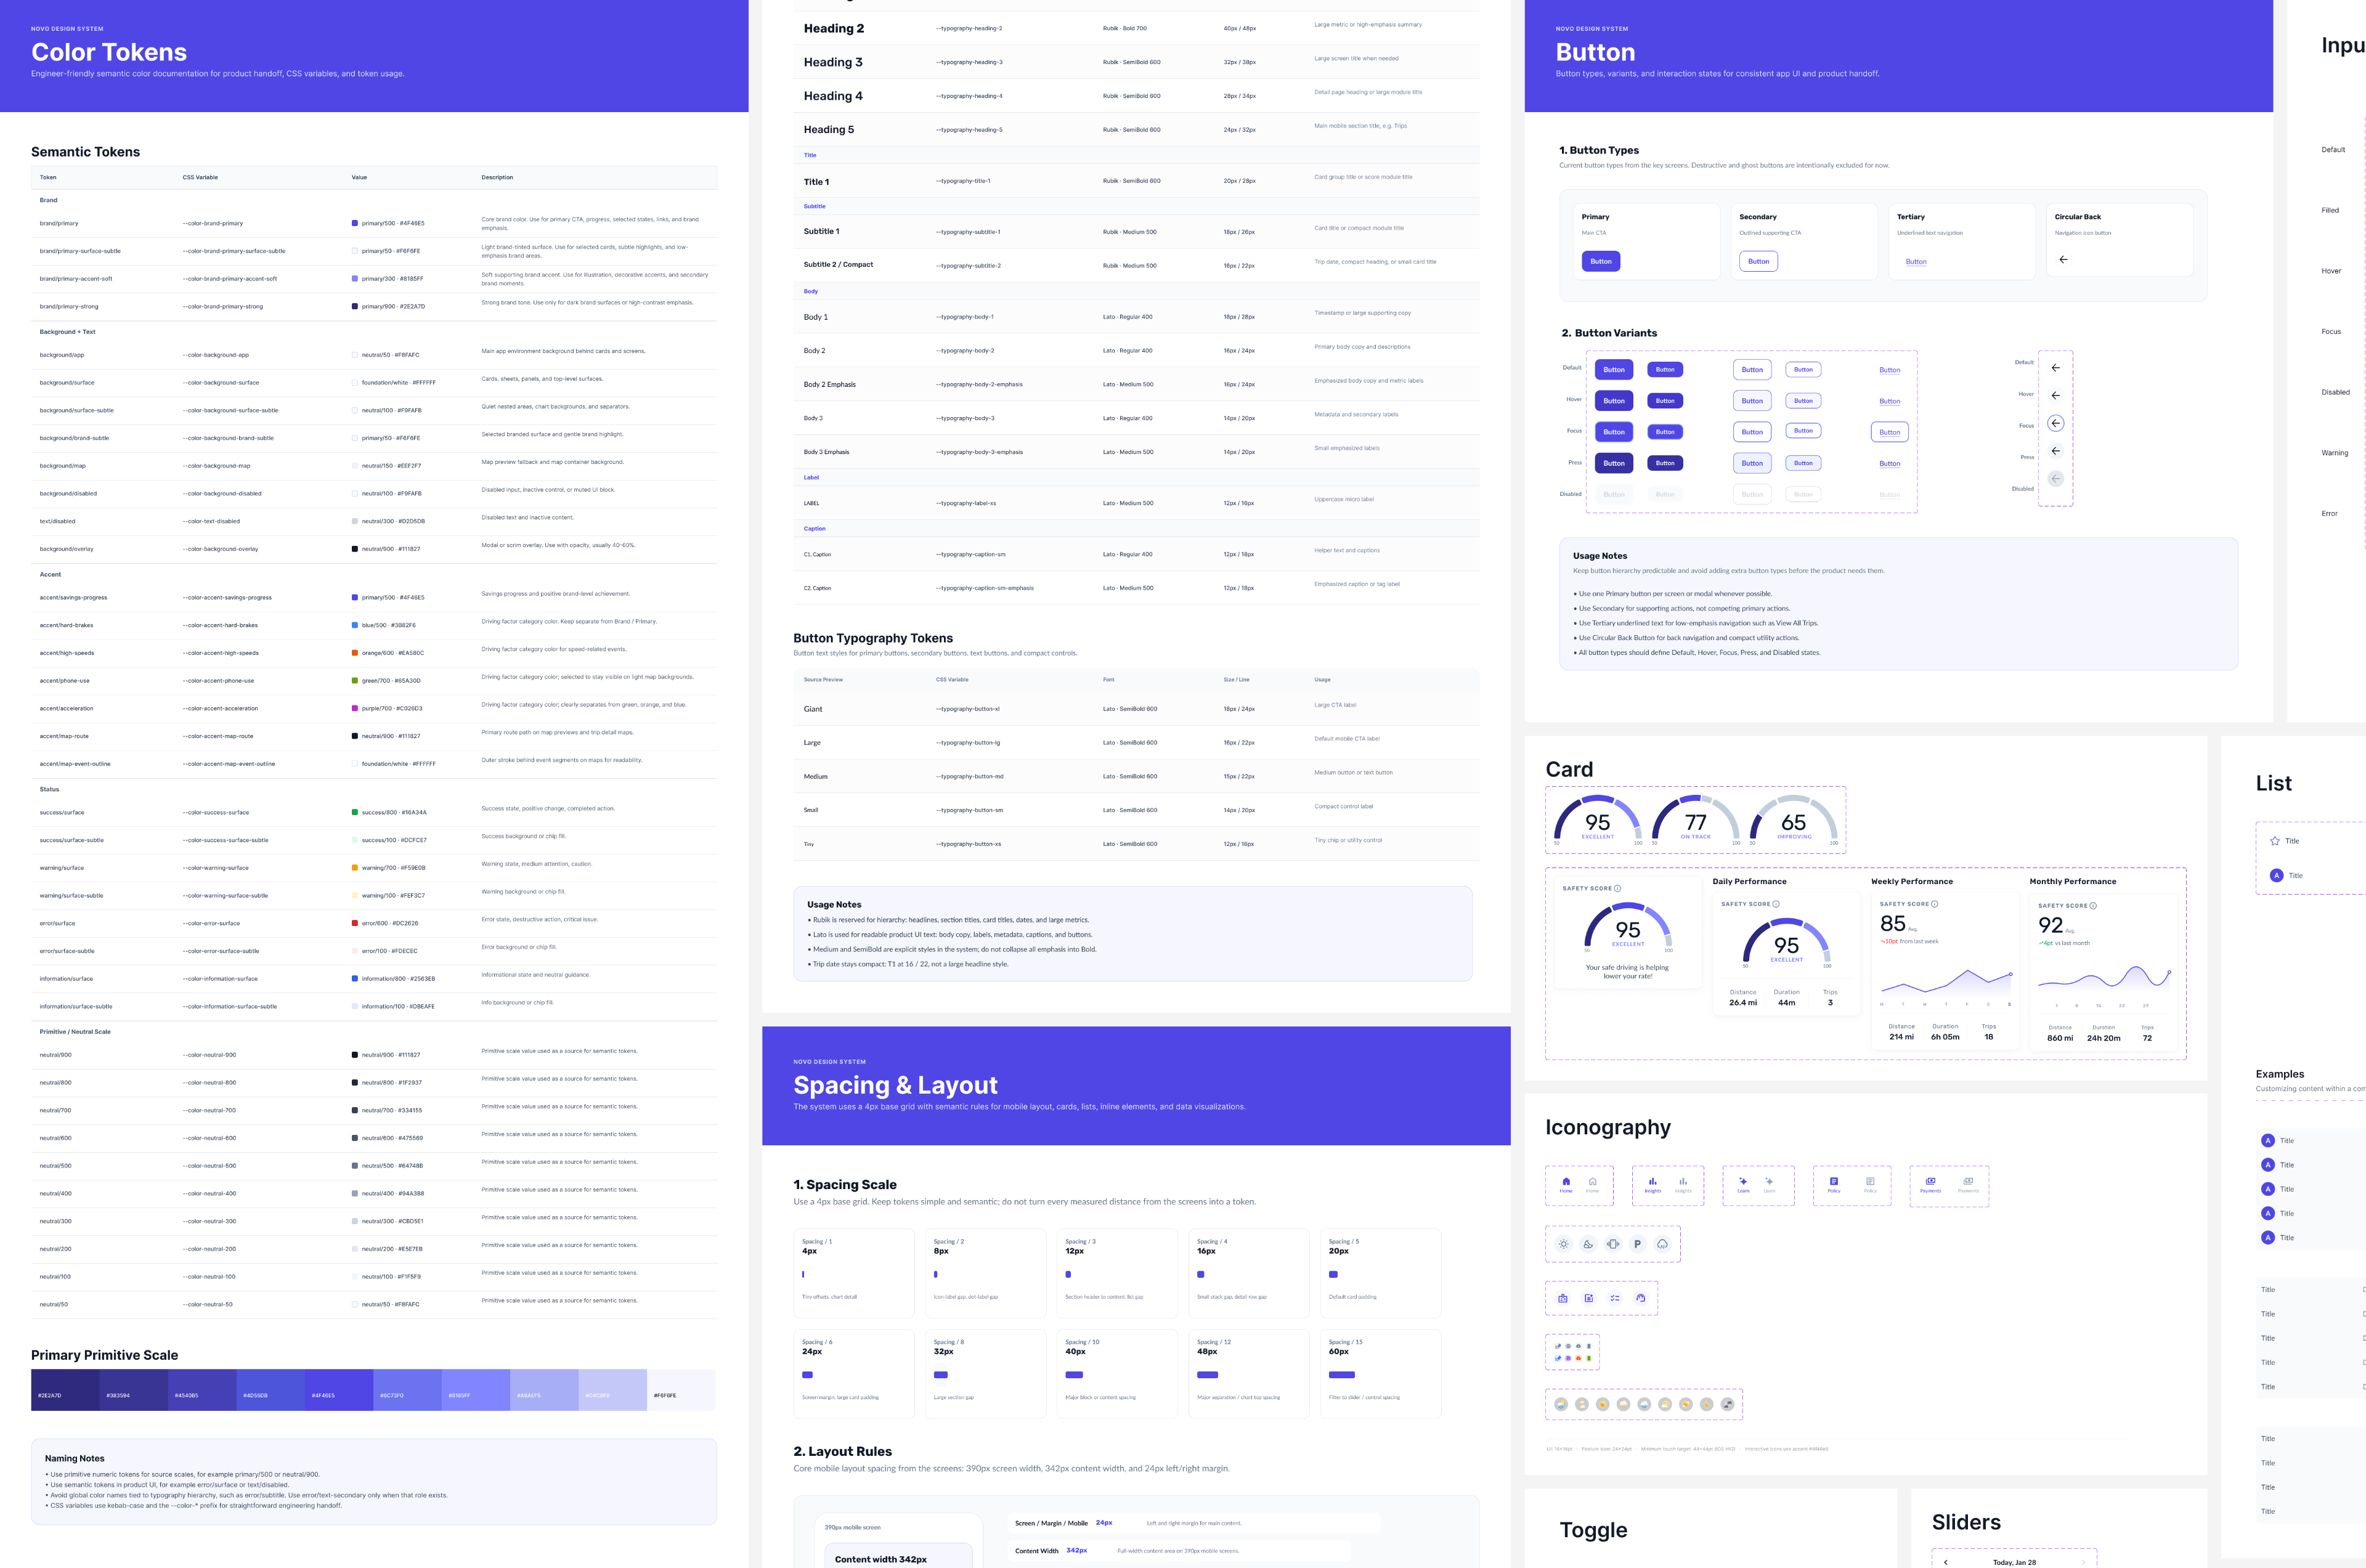
Creating a System for Consistent Product Growth
A unified design system was created to ensure consistency across components, typography, and interactive patterns, streamlining the workflow for future updates.
Outcomes
2.5×
increase in engagement with driving insights
60%+ of beta users interacted with insights weekly Time spent on insight pages increased by ~40%